Data Visualisation using Power BI Training in Hyderabad, Bangalore, Pune & india(Online)
Microsoft Power BI is one of the most popular BI platforms. By taking the Power BI curriculum offered by Data Minds, you’ll learn all about Microsoft Power BI concepts like screen layouts, DAX commands, reports, dashboards, and more. In addition, you will learn how to examine, prepare, calibrate and present data in an easy-to-use manner. With the Power BI training we offer, you’ll get a hands-on approach to the software that makes you an expert.
2 Months
Duration
2500+
Course Enrollments
100%
Placement Assistance
EMI
Partner Banks

Excel

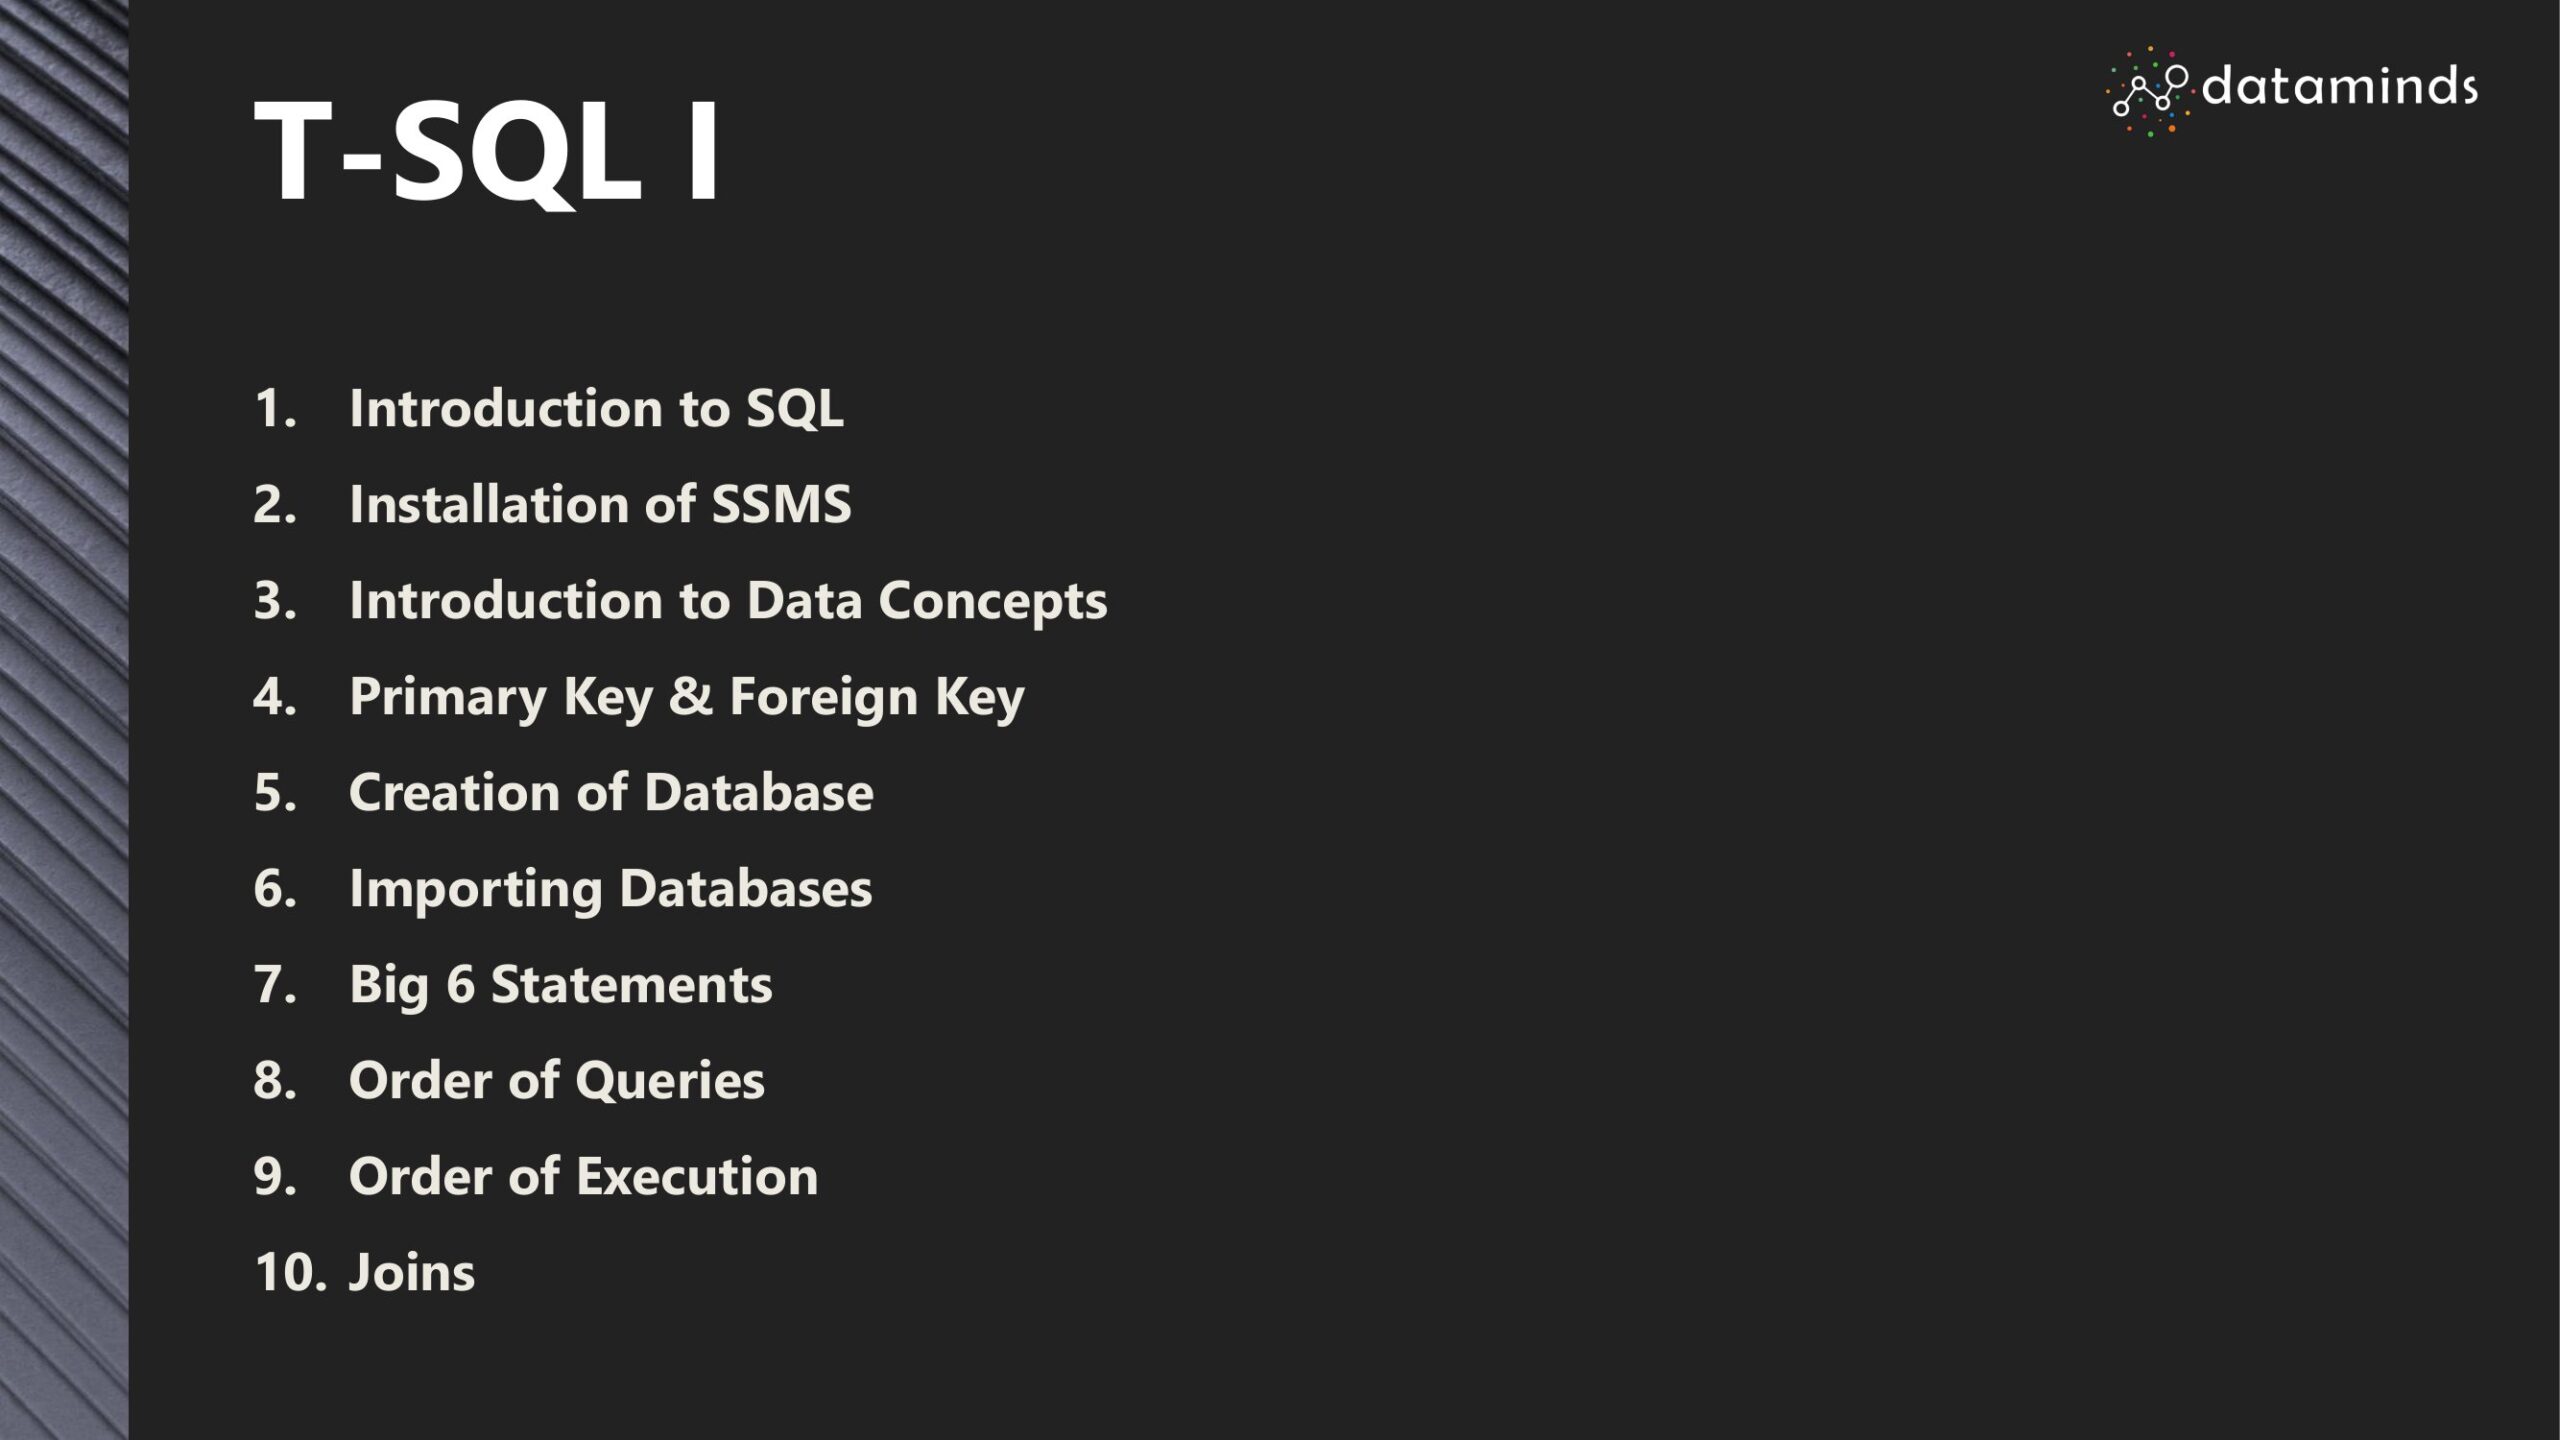
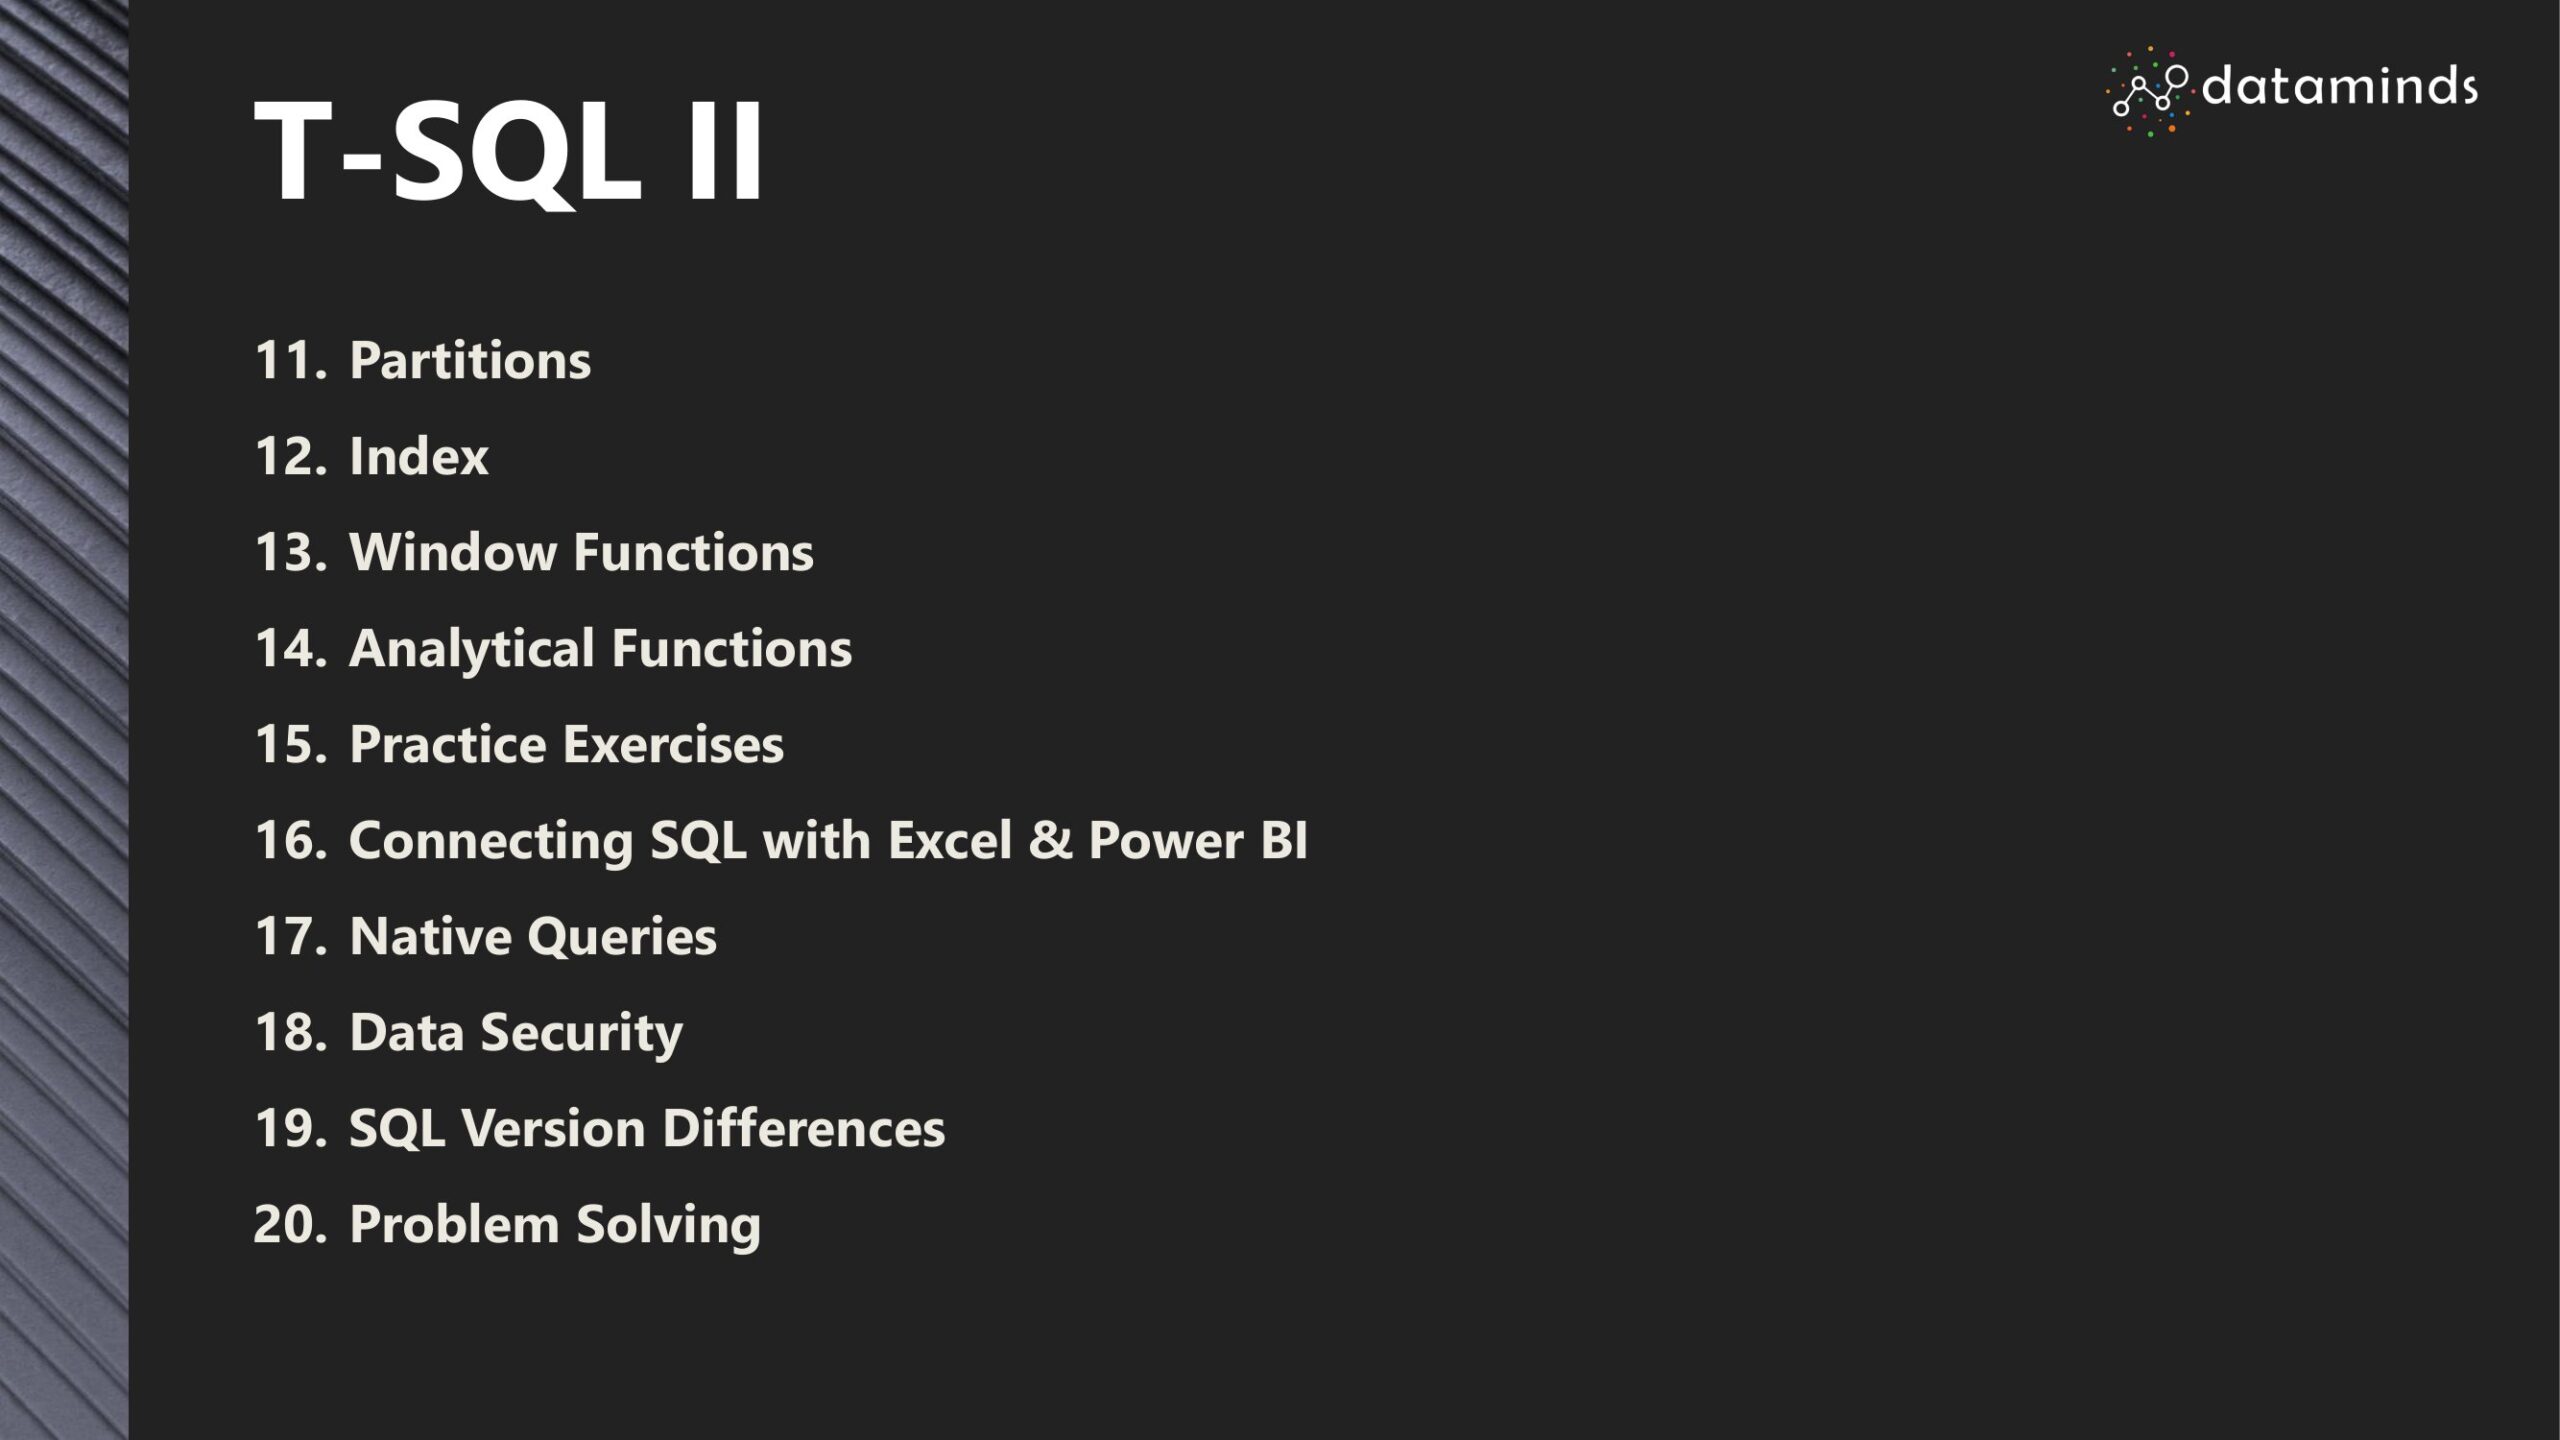
T-SQL

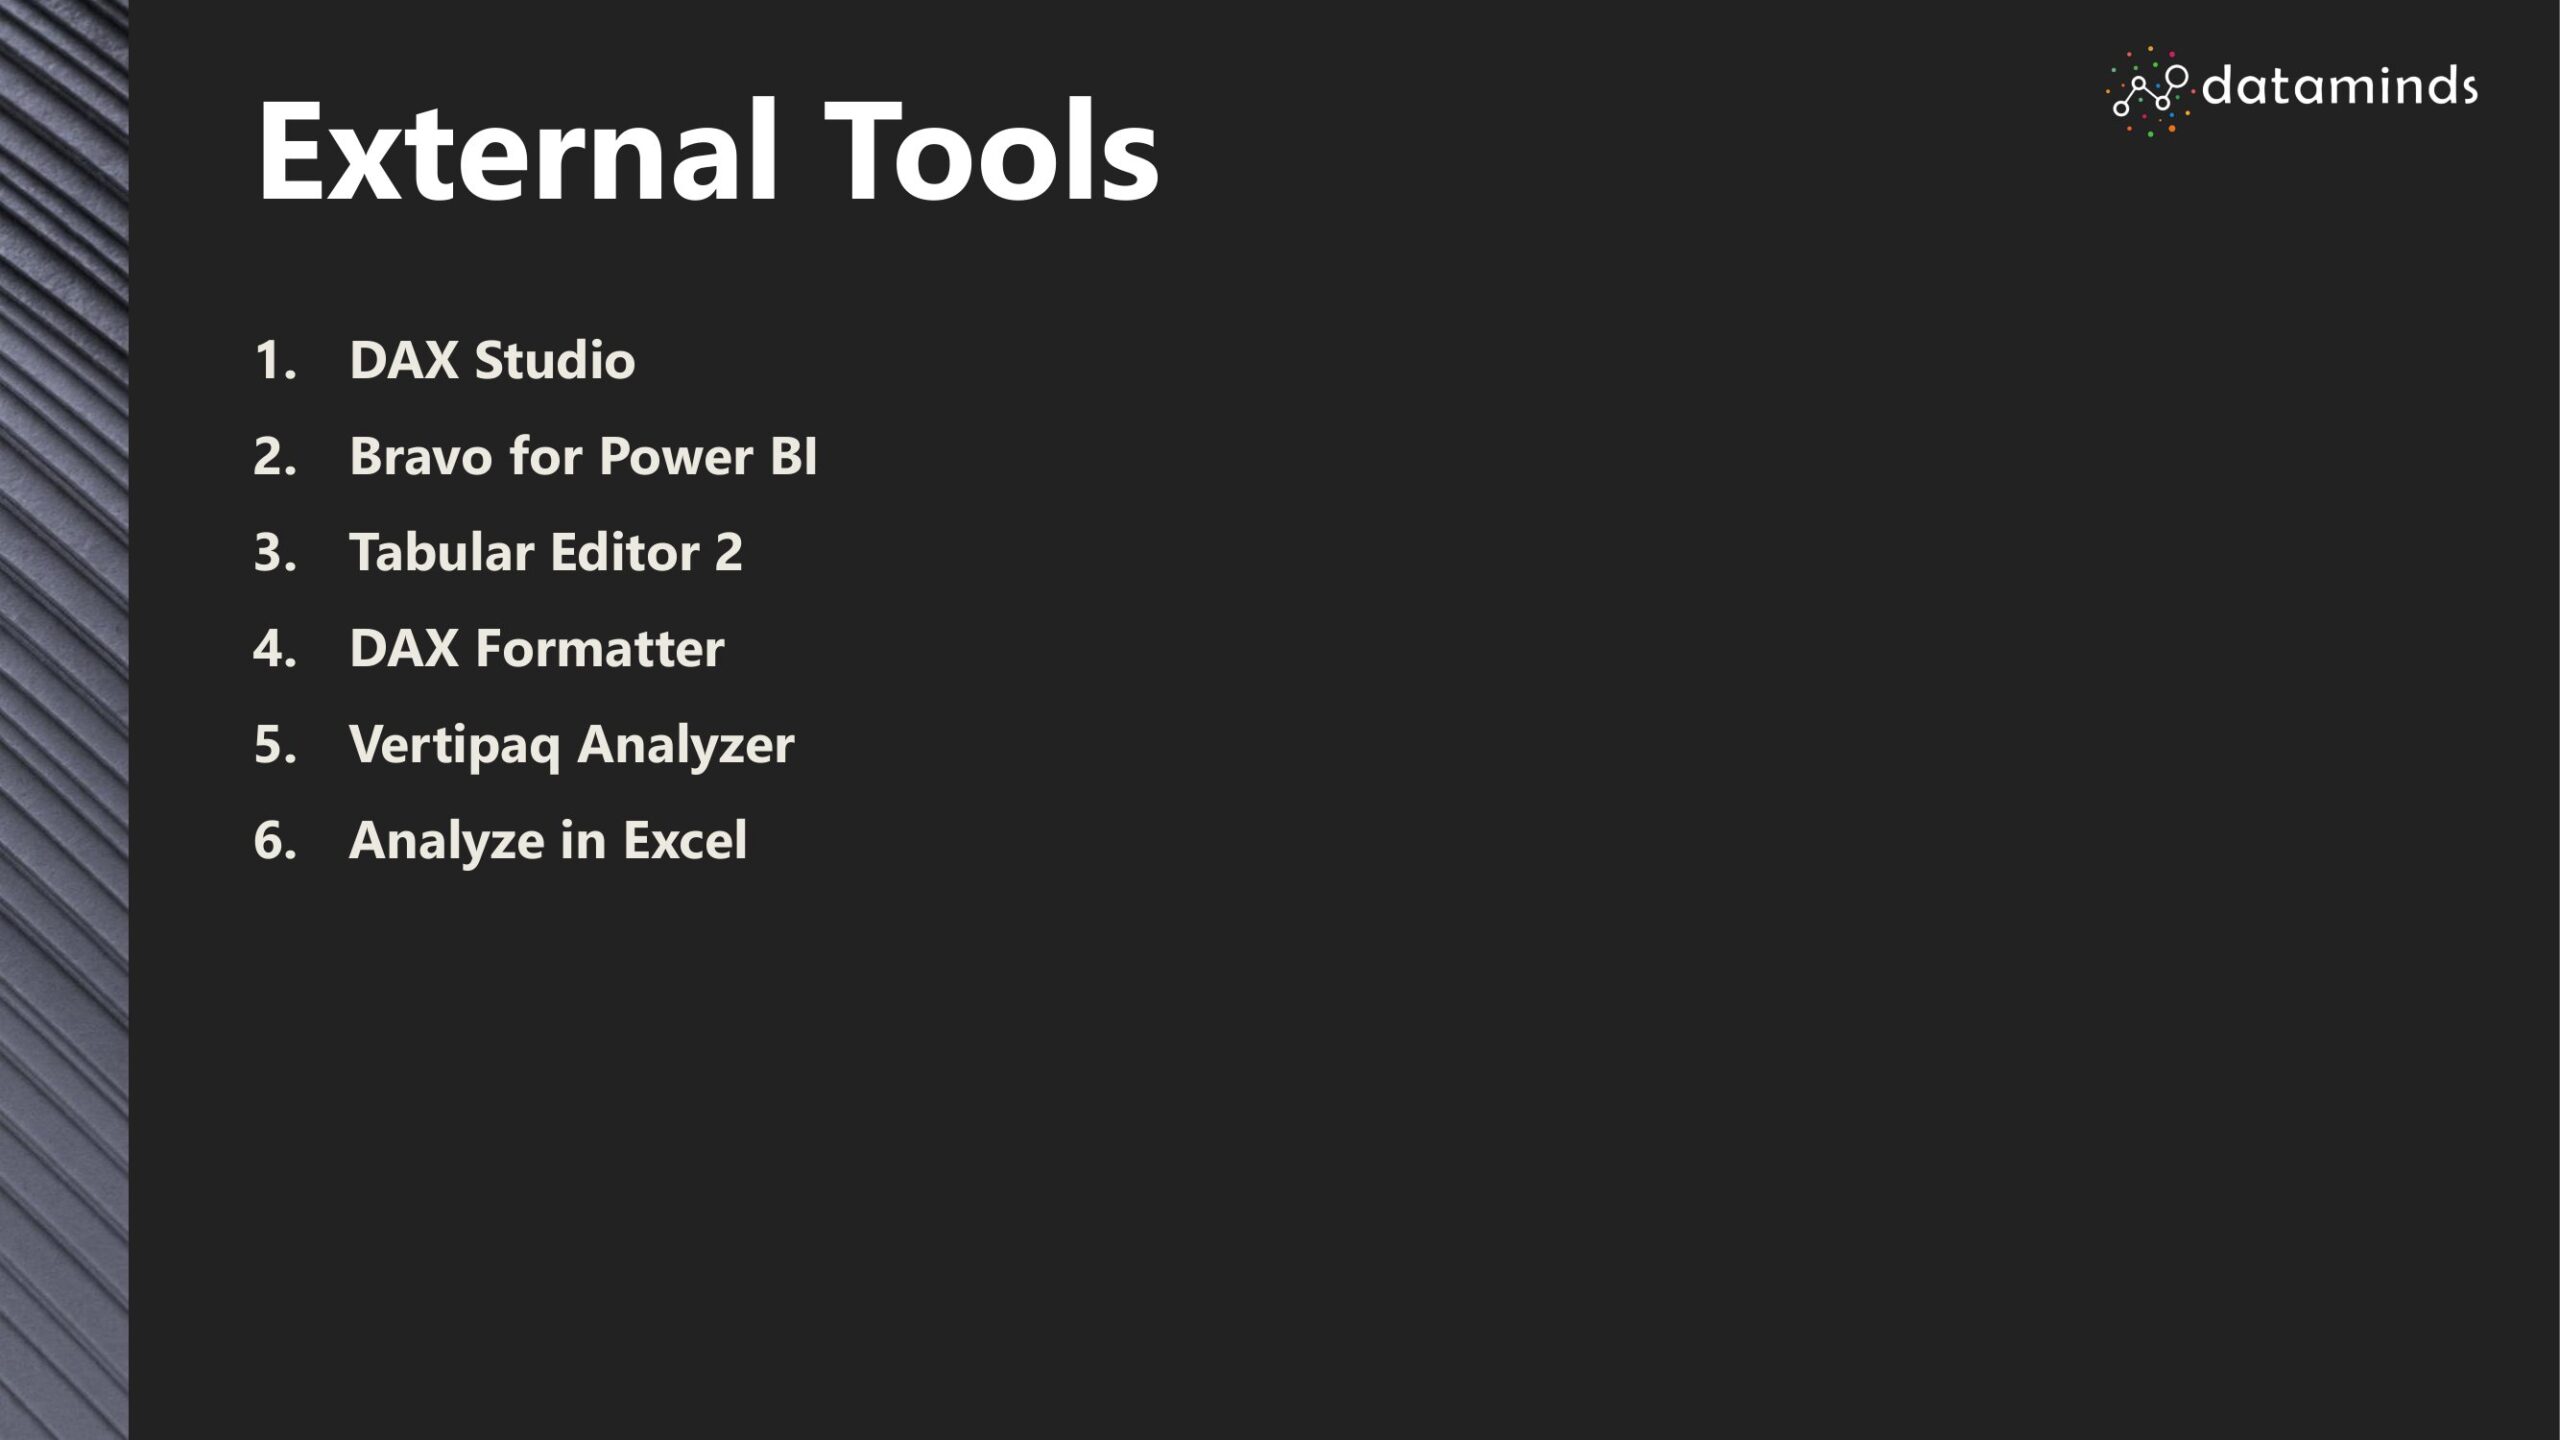
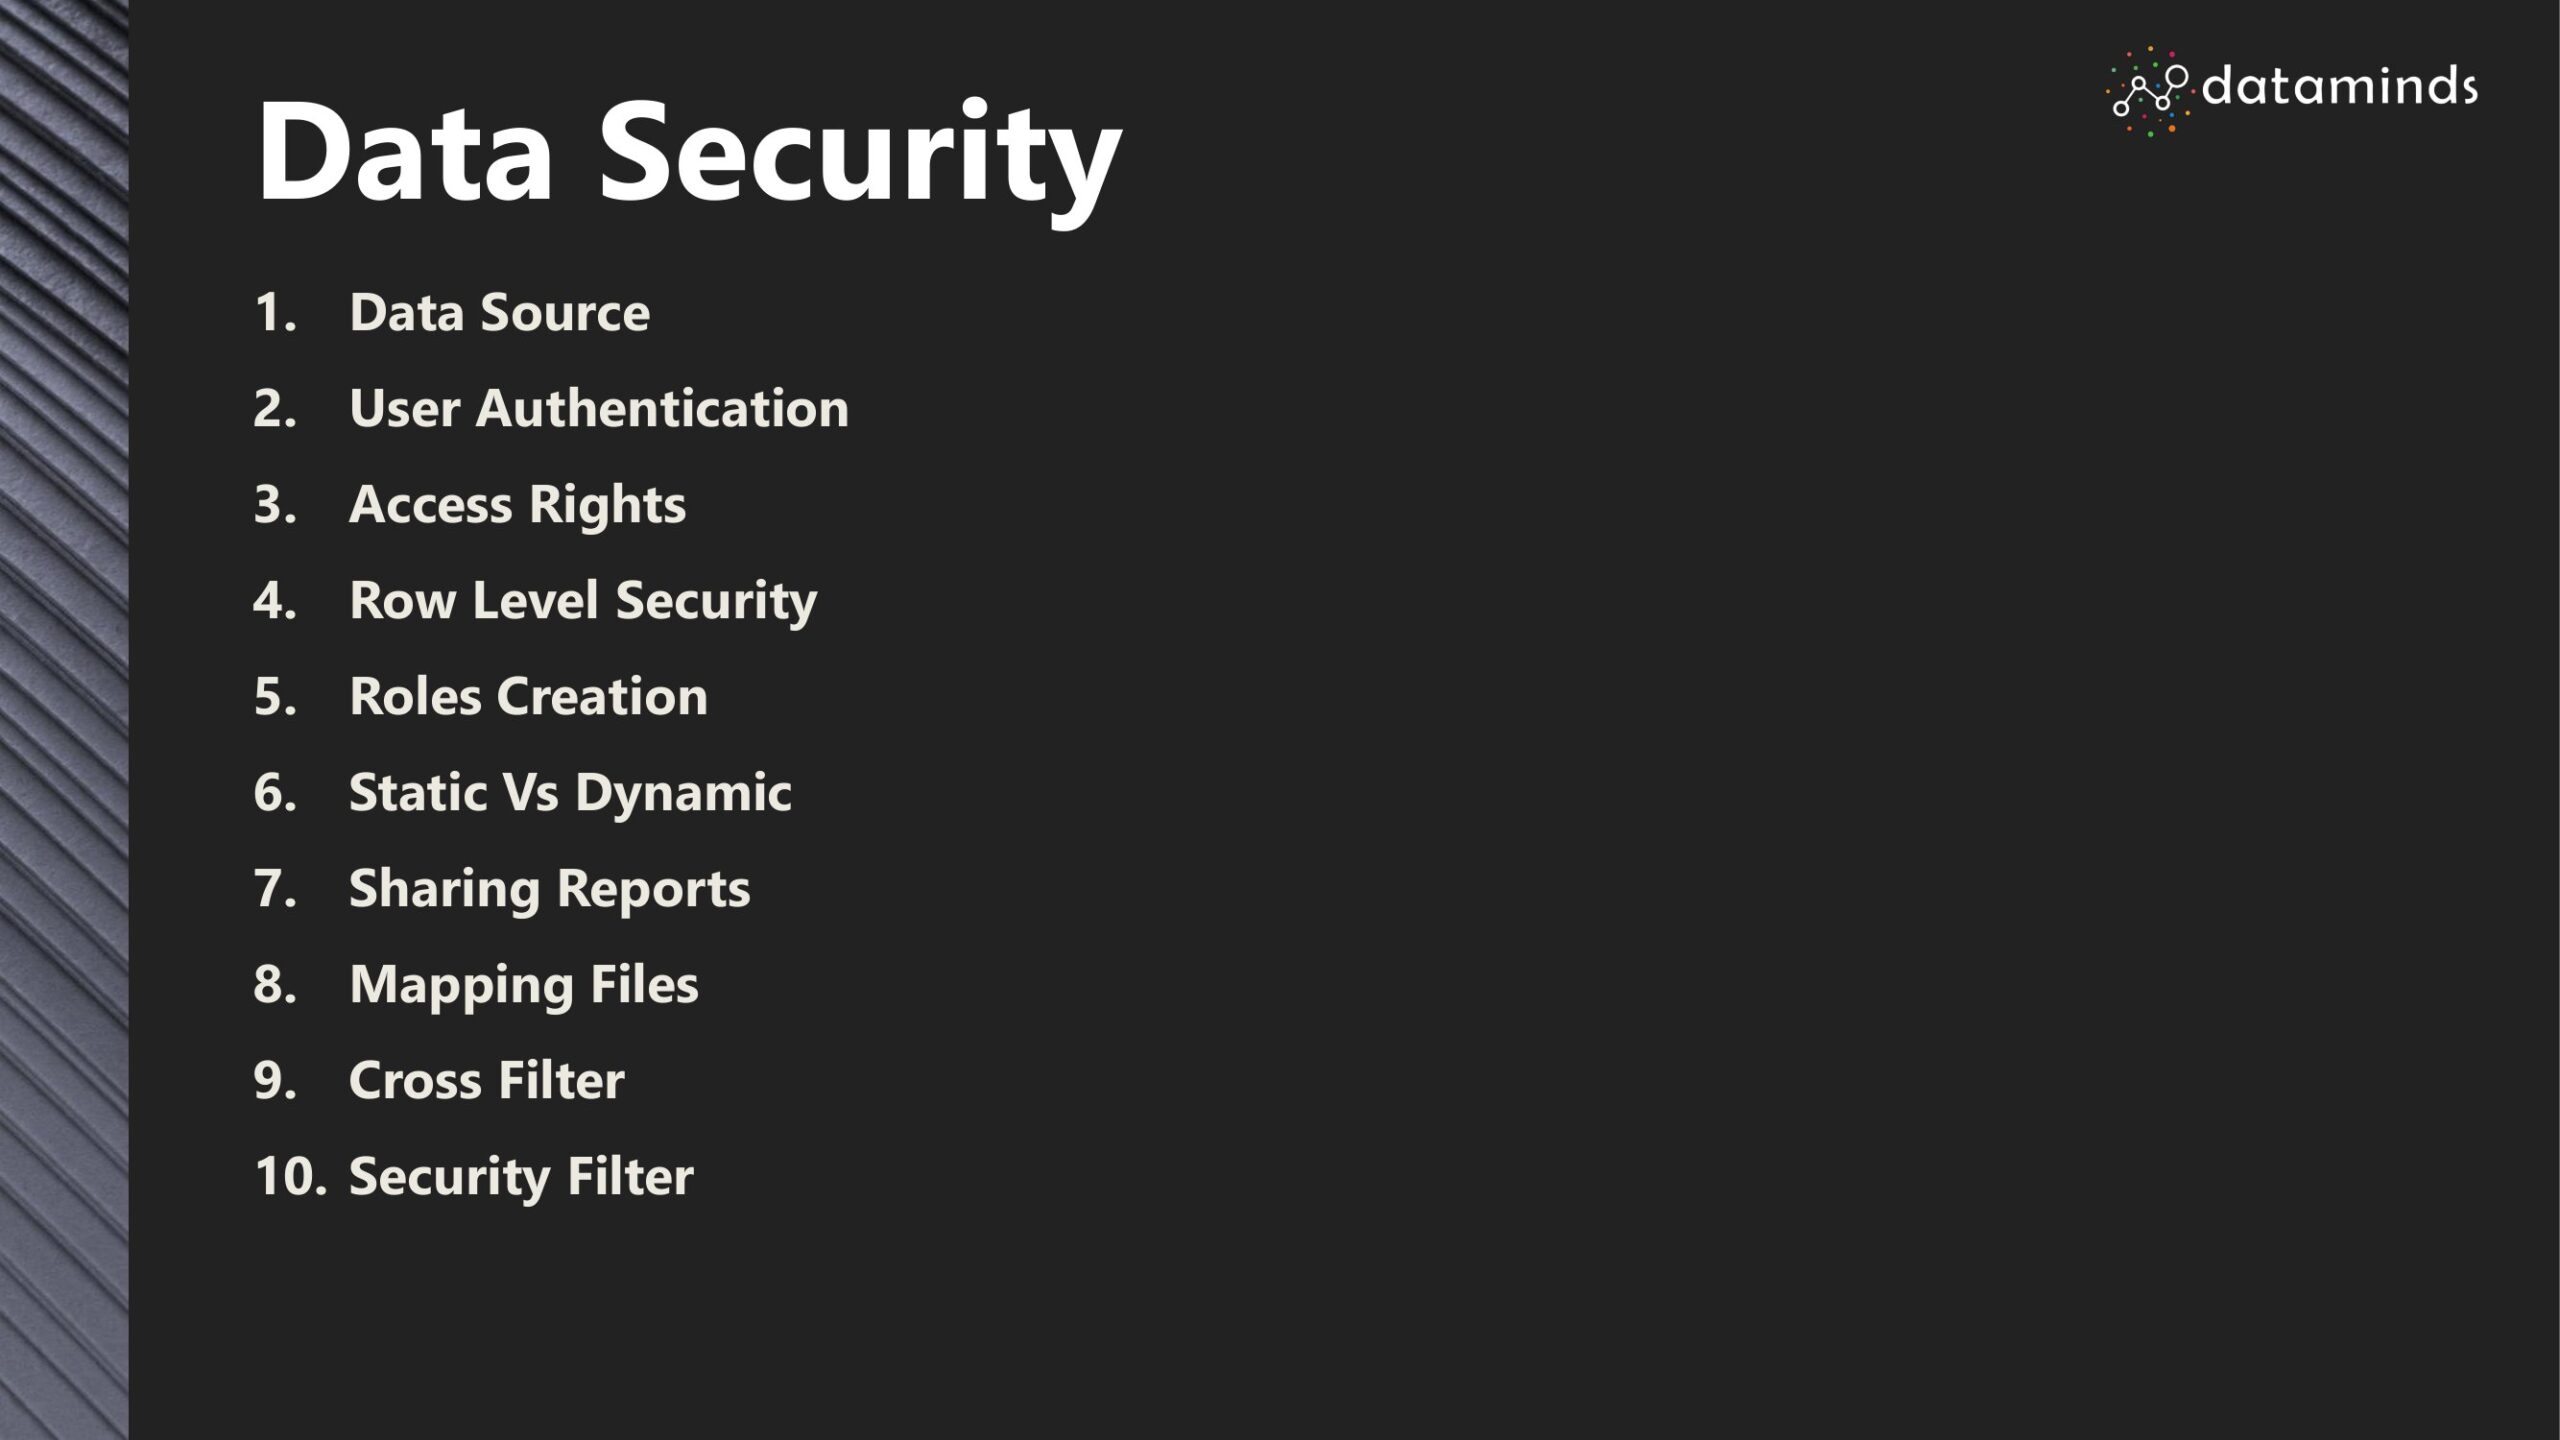
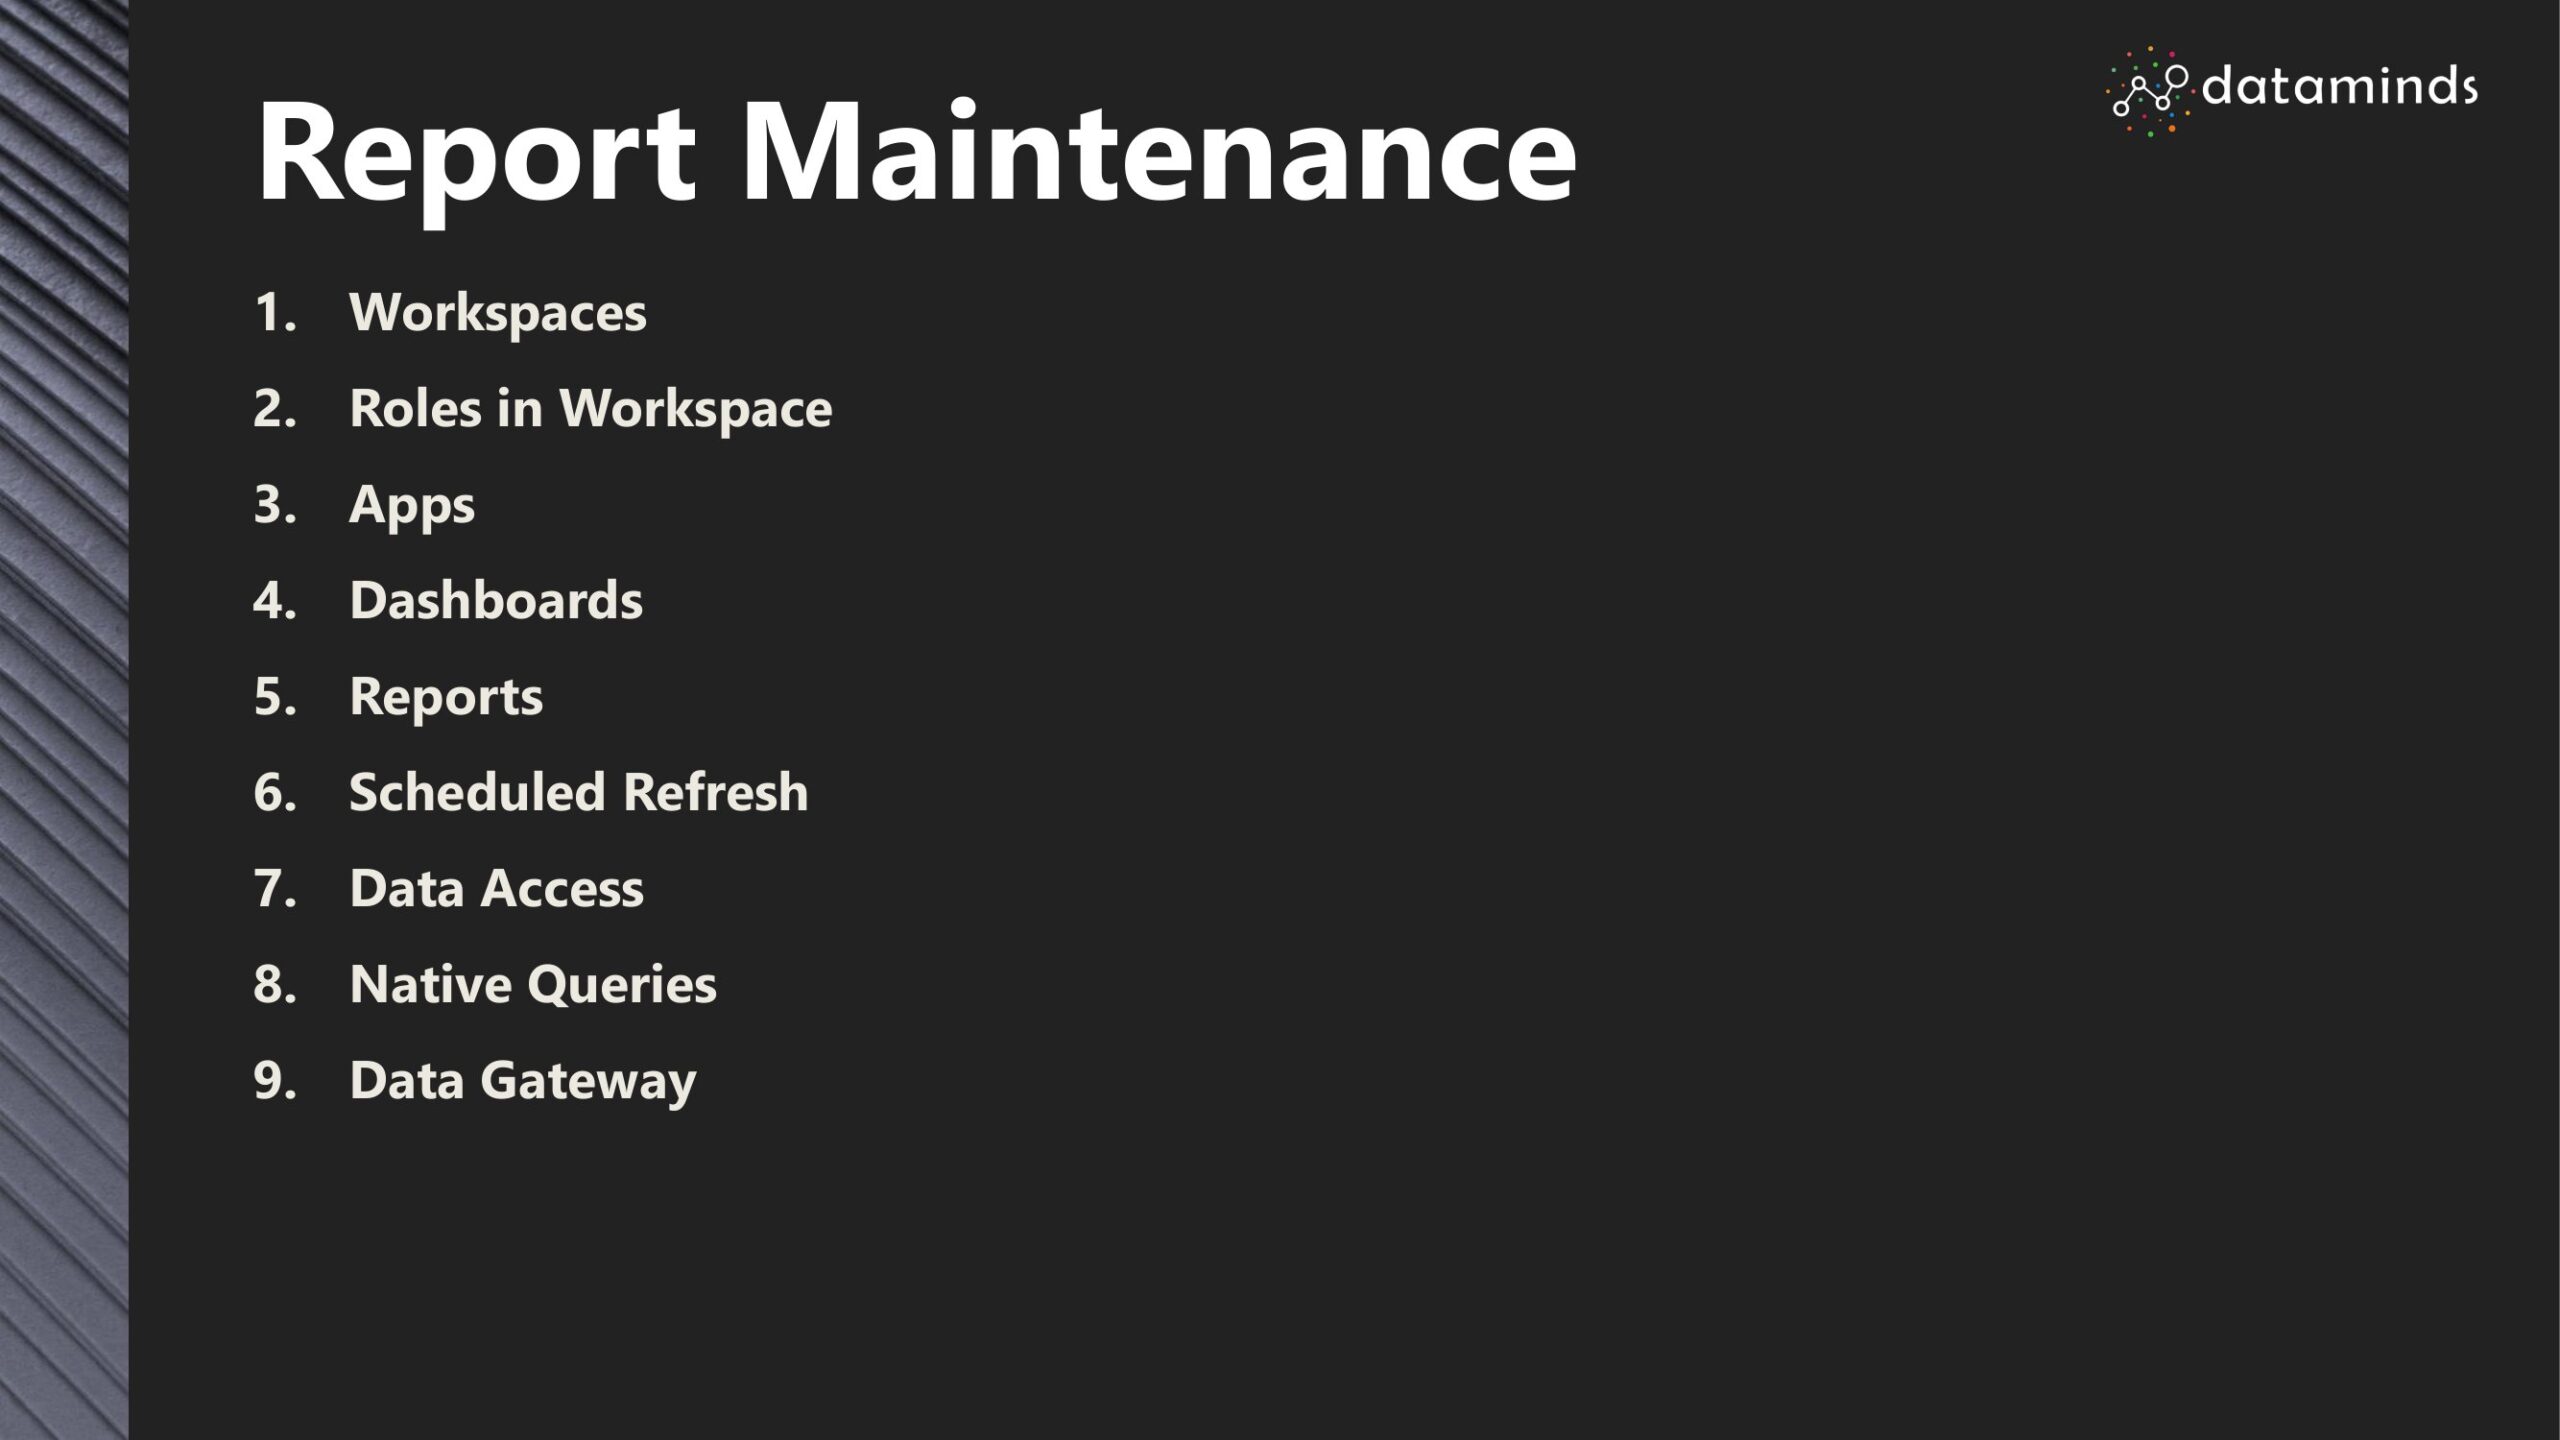
Power BI

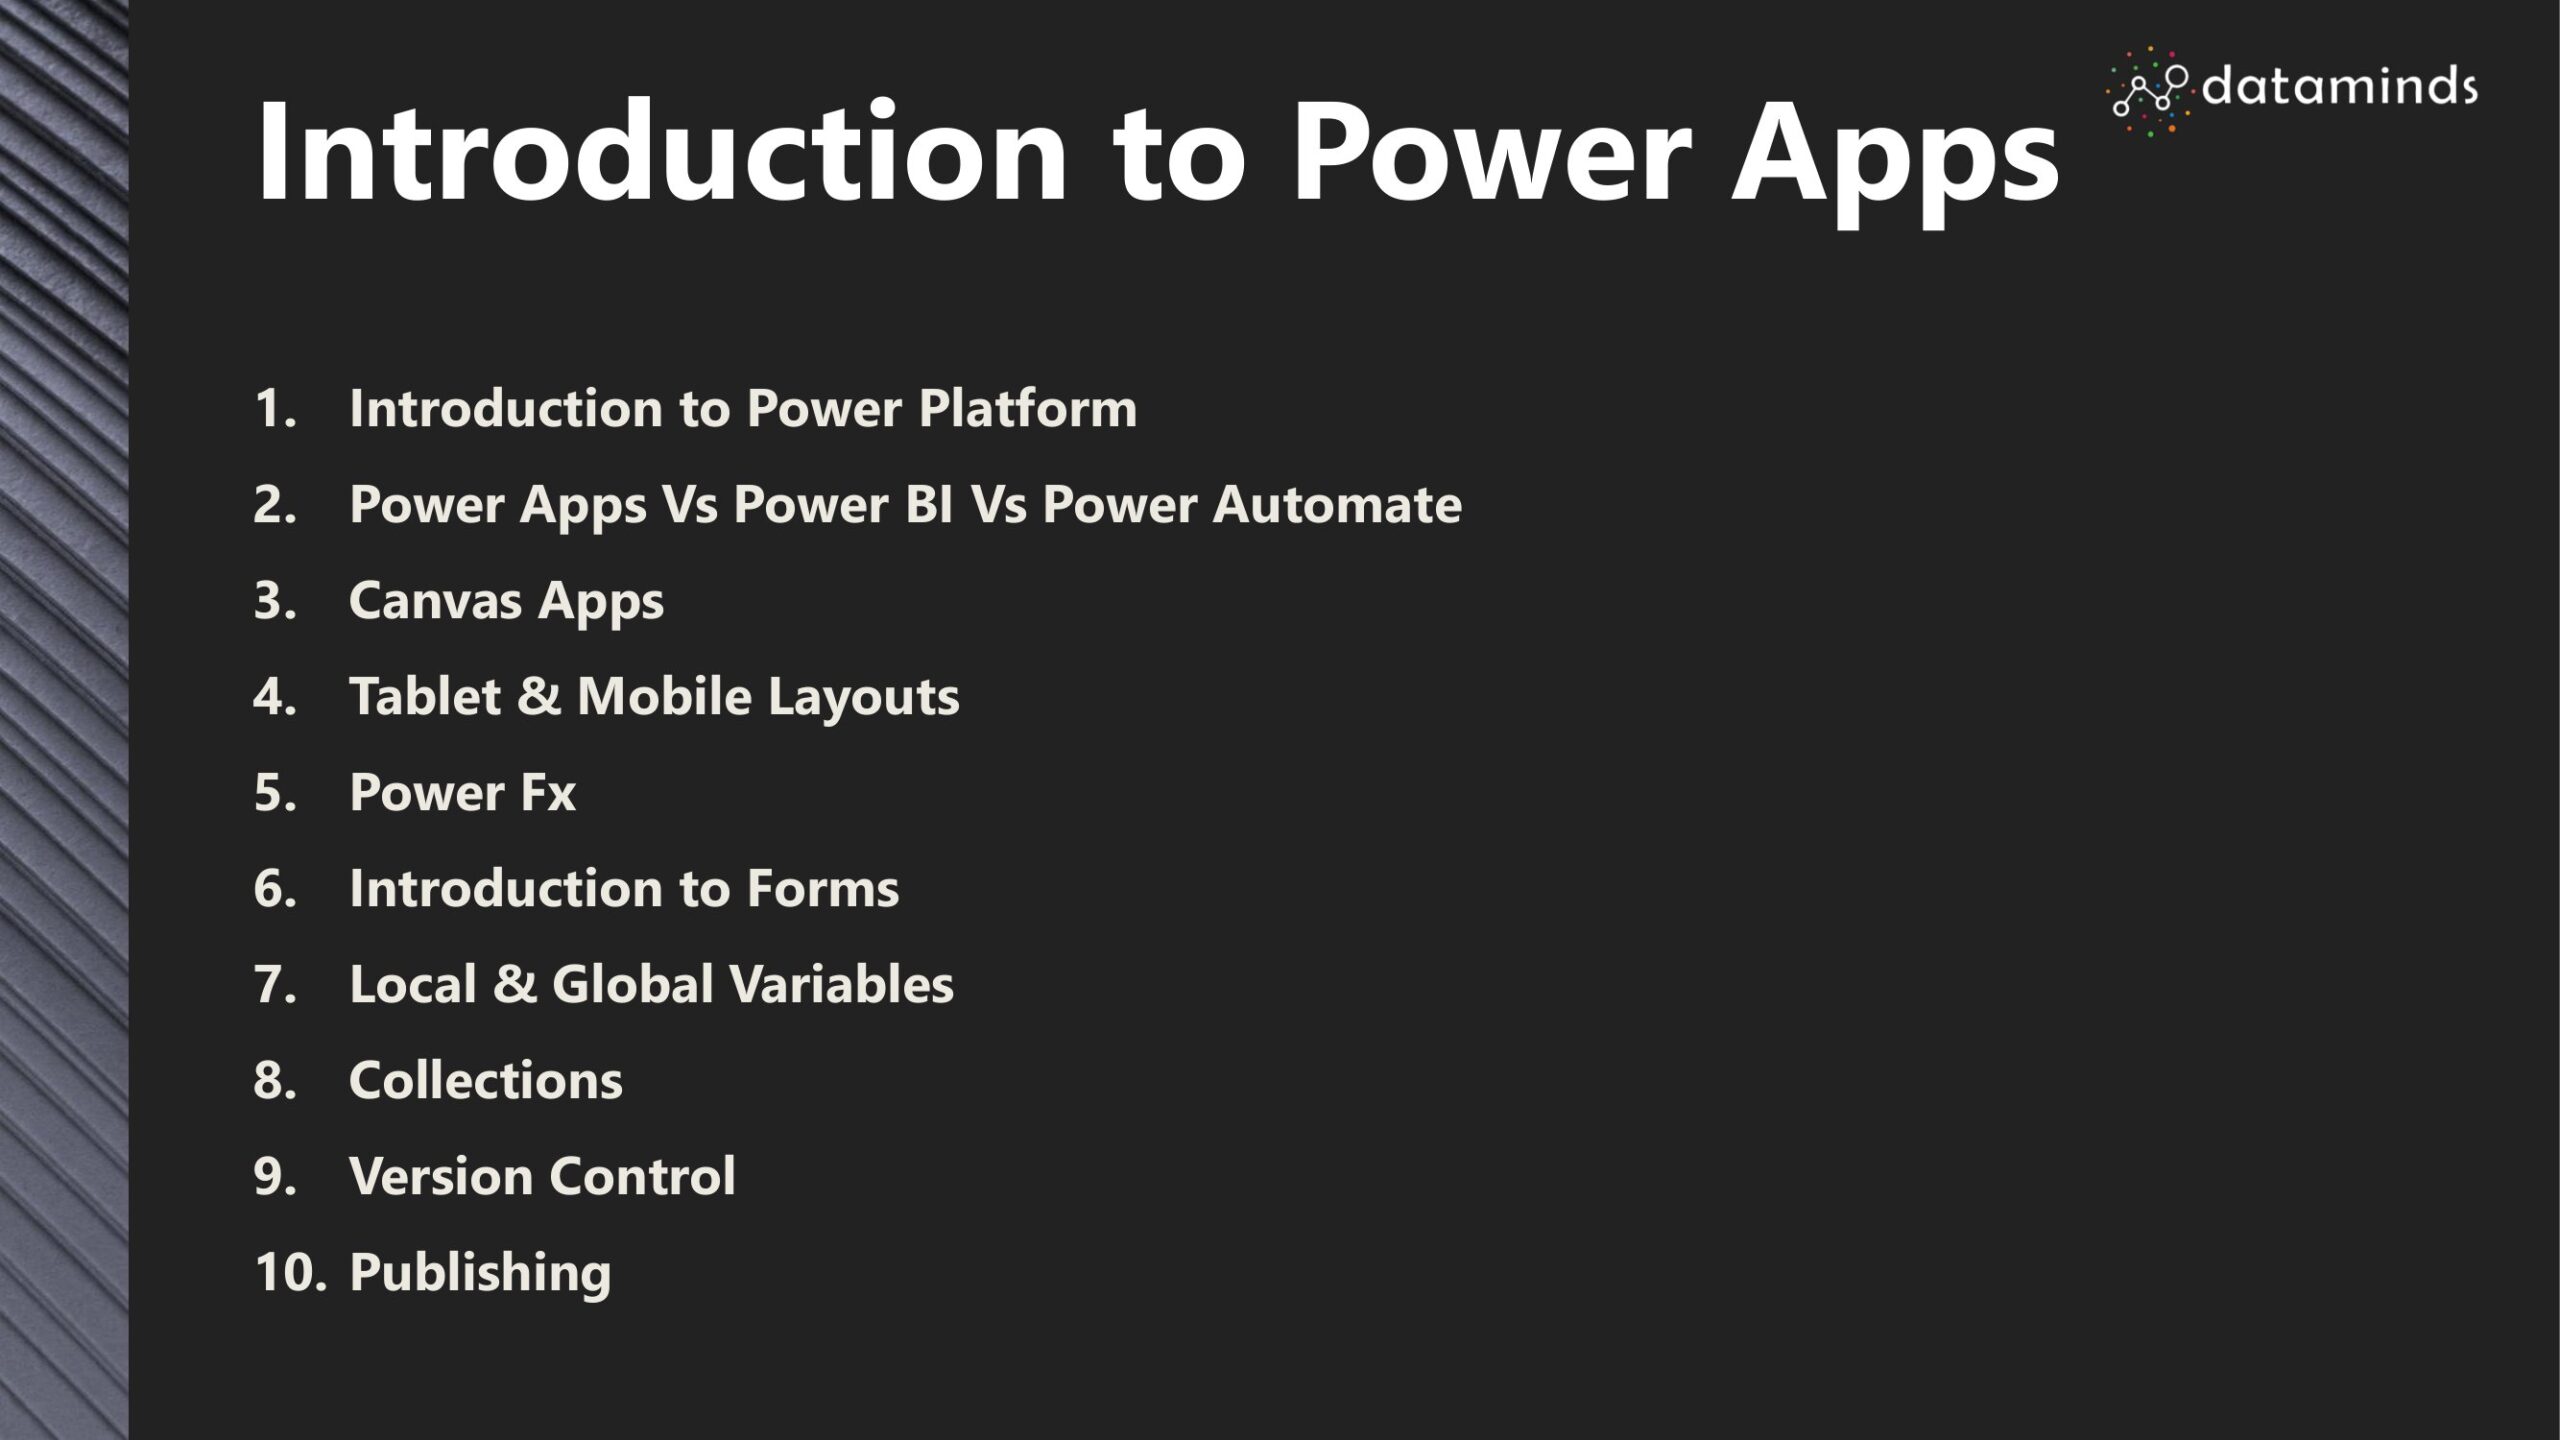
Power Apps
Key Highlights Of Course
Key Highlights of Course 100+ Hourse of Course
Student Mentorship
Capstone Projects
15+ Assignments
Backup Classes, Videos
100% Placements Assistance
EMI Option Available
Mock Interview
Interview Preparation
Resume Building After Every Module
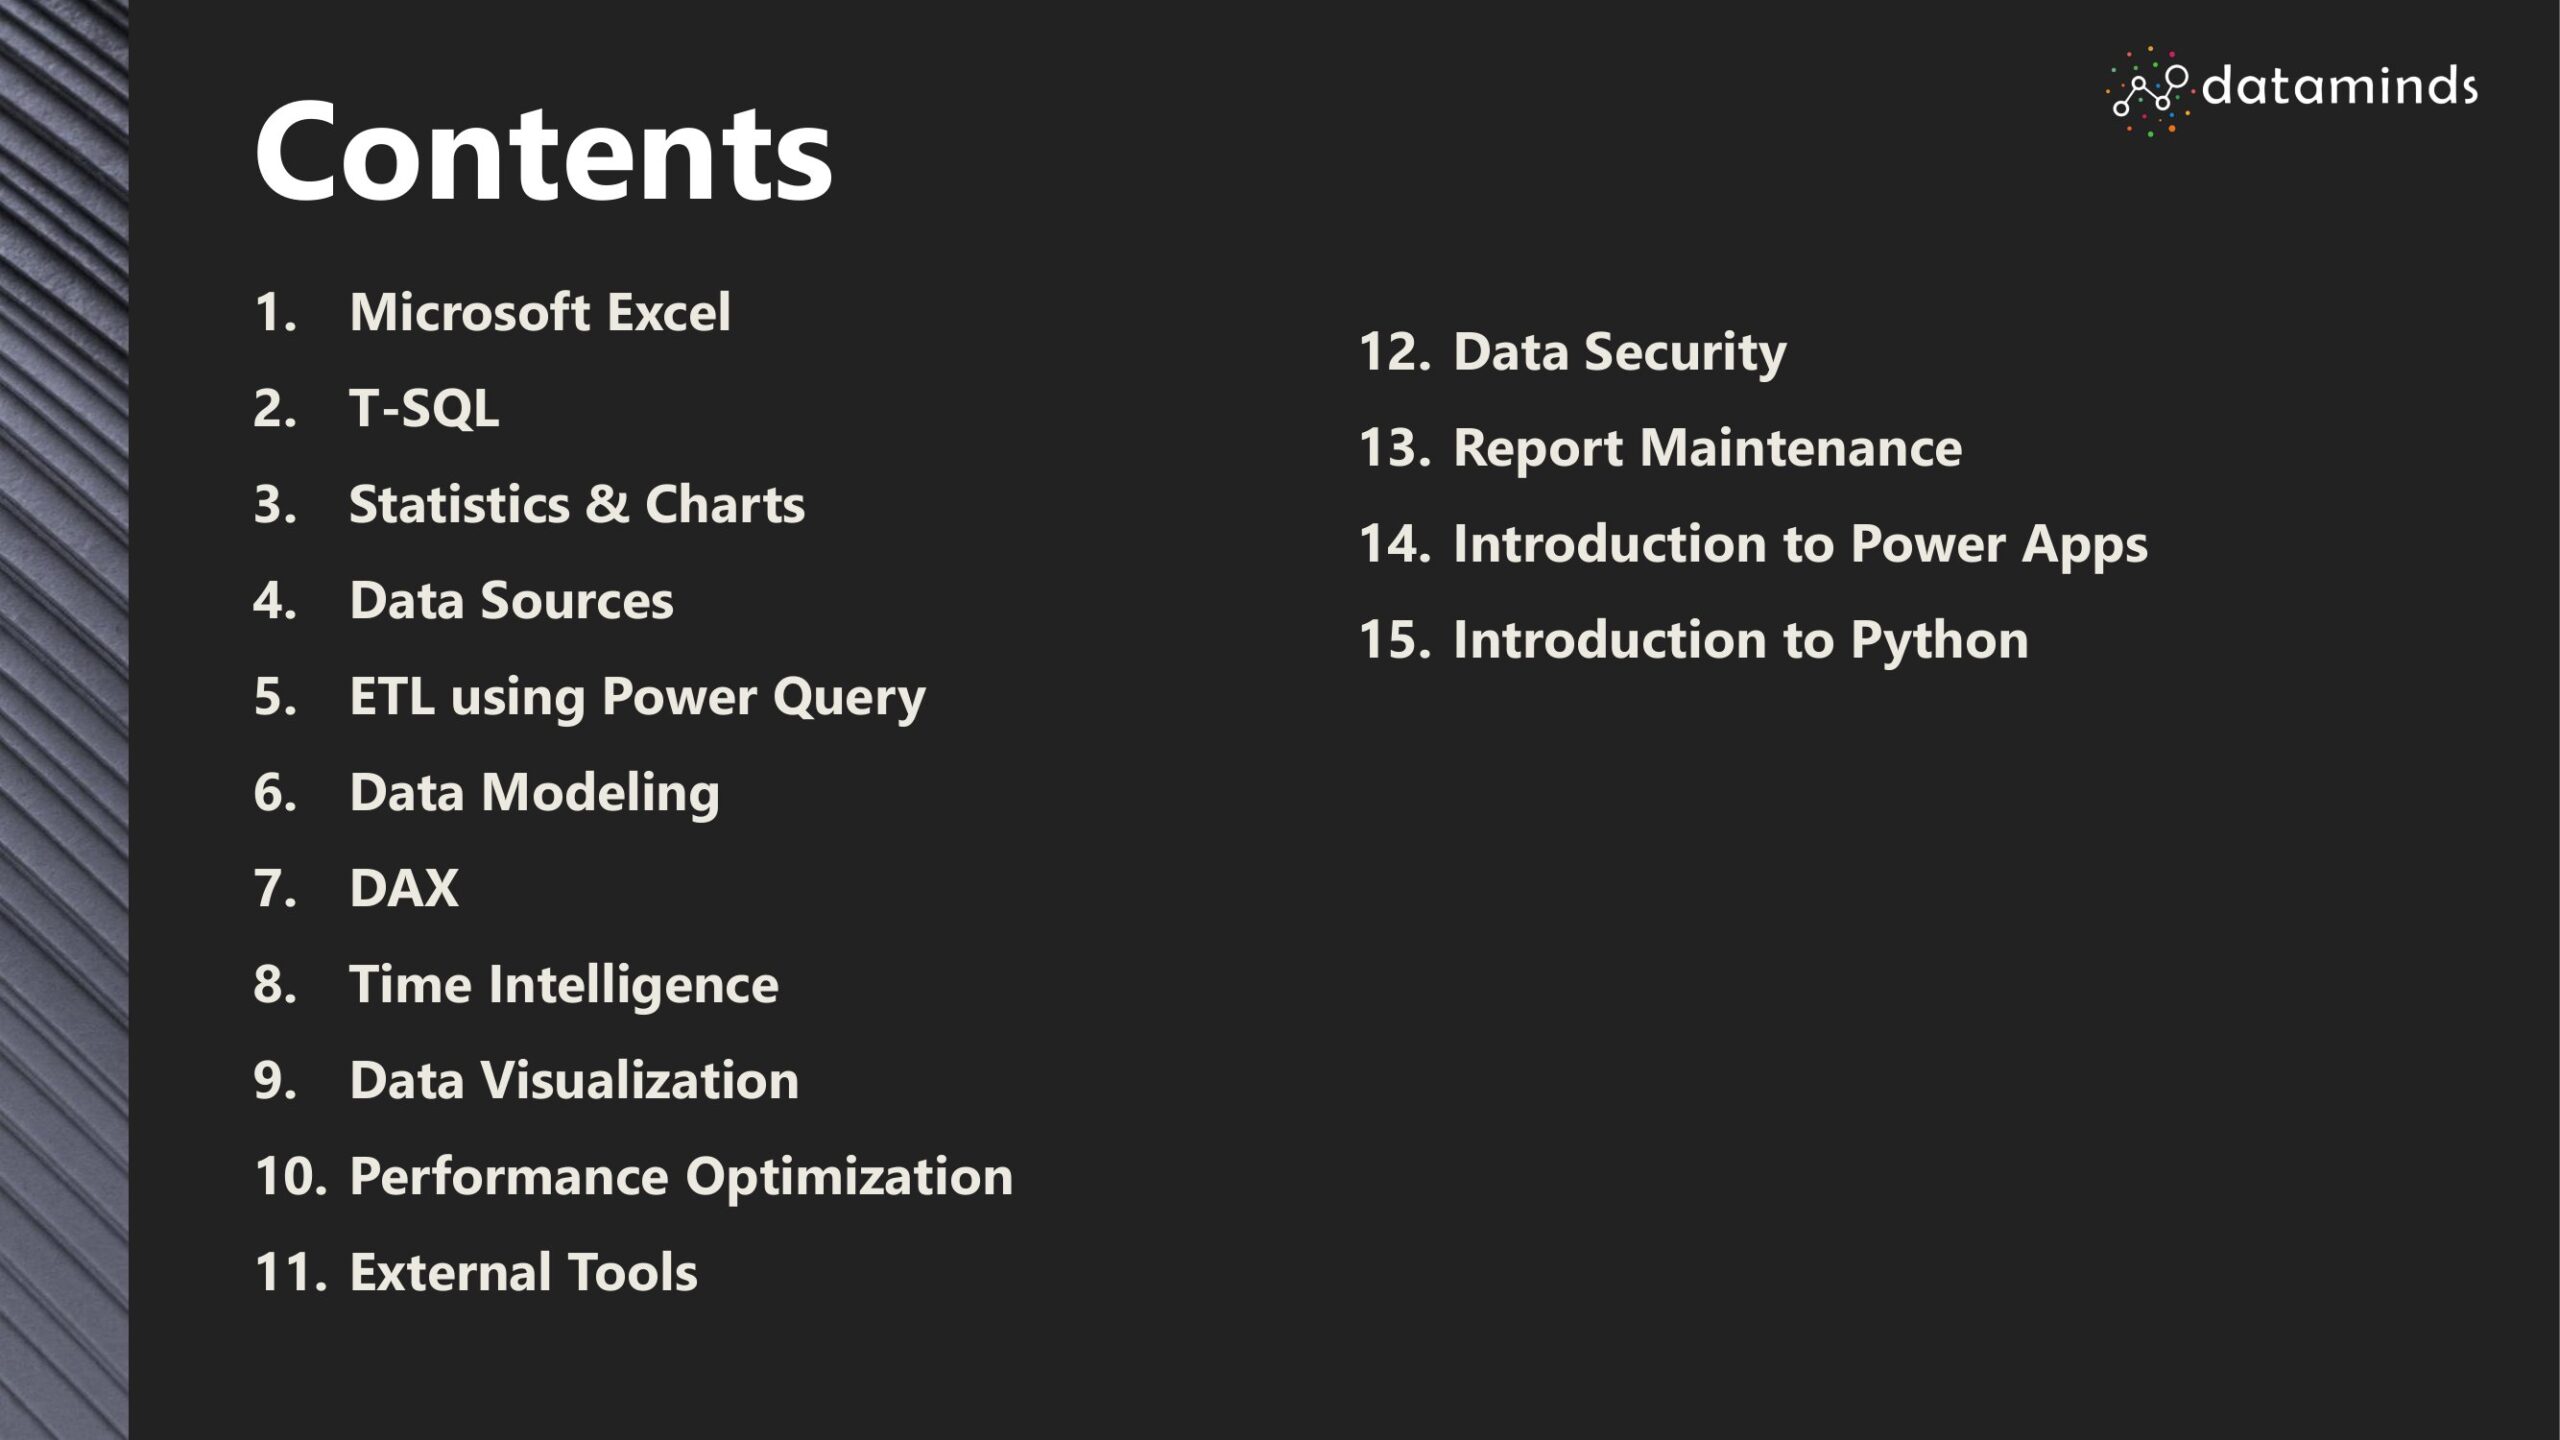
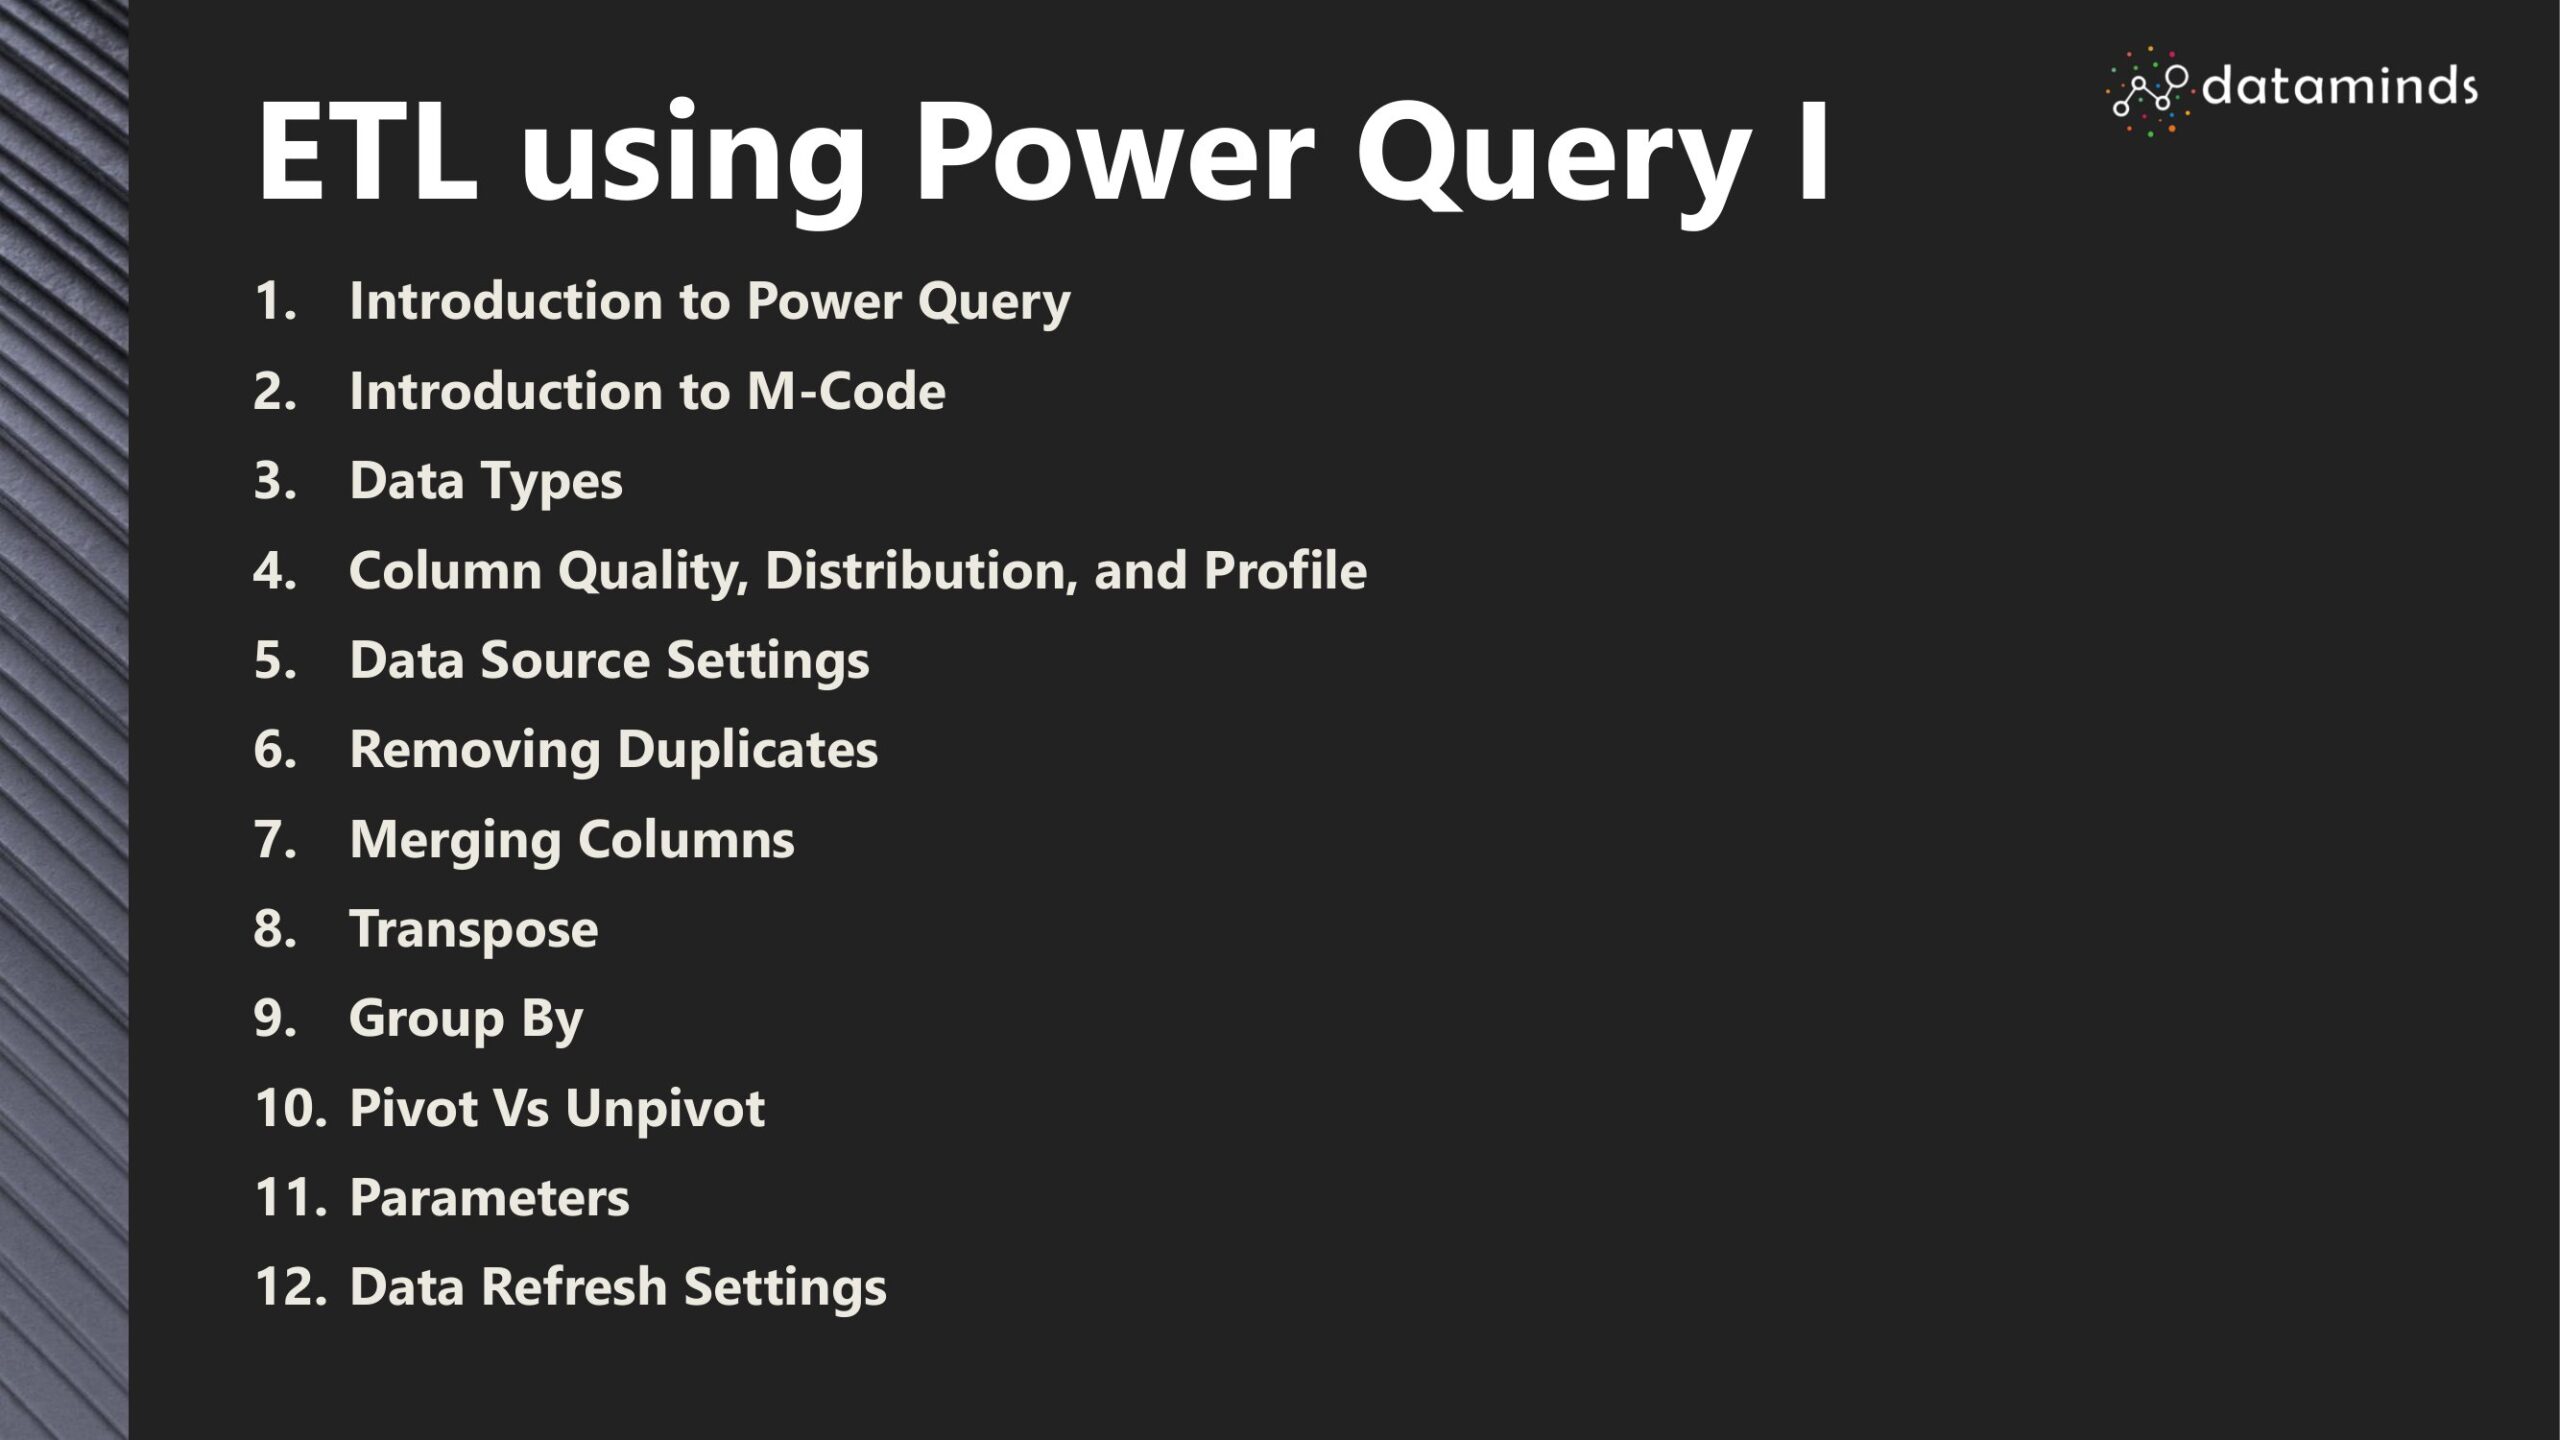
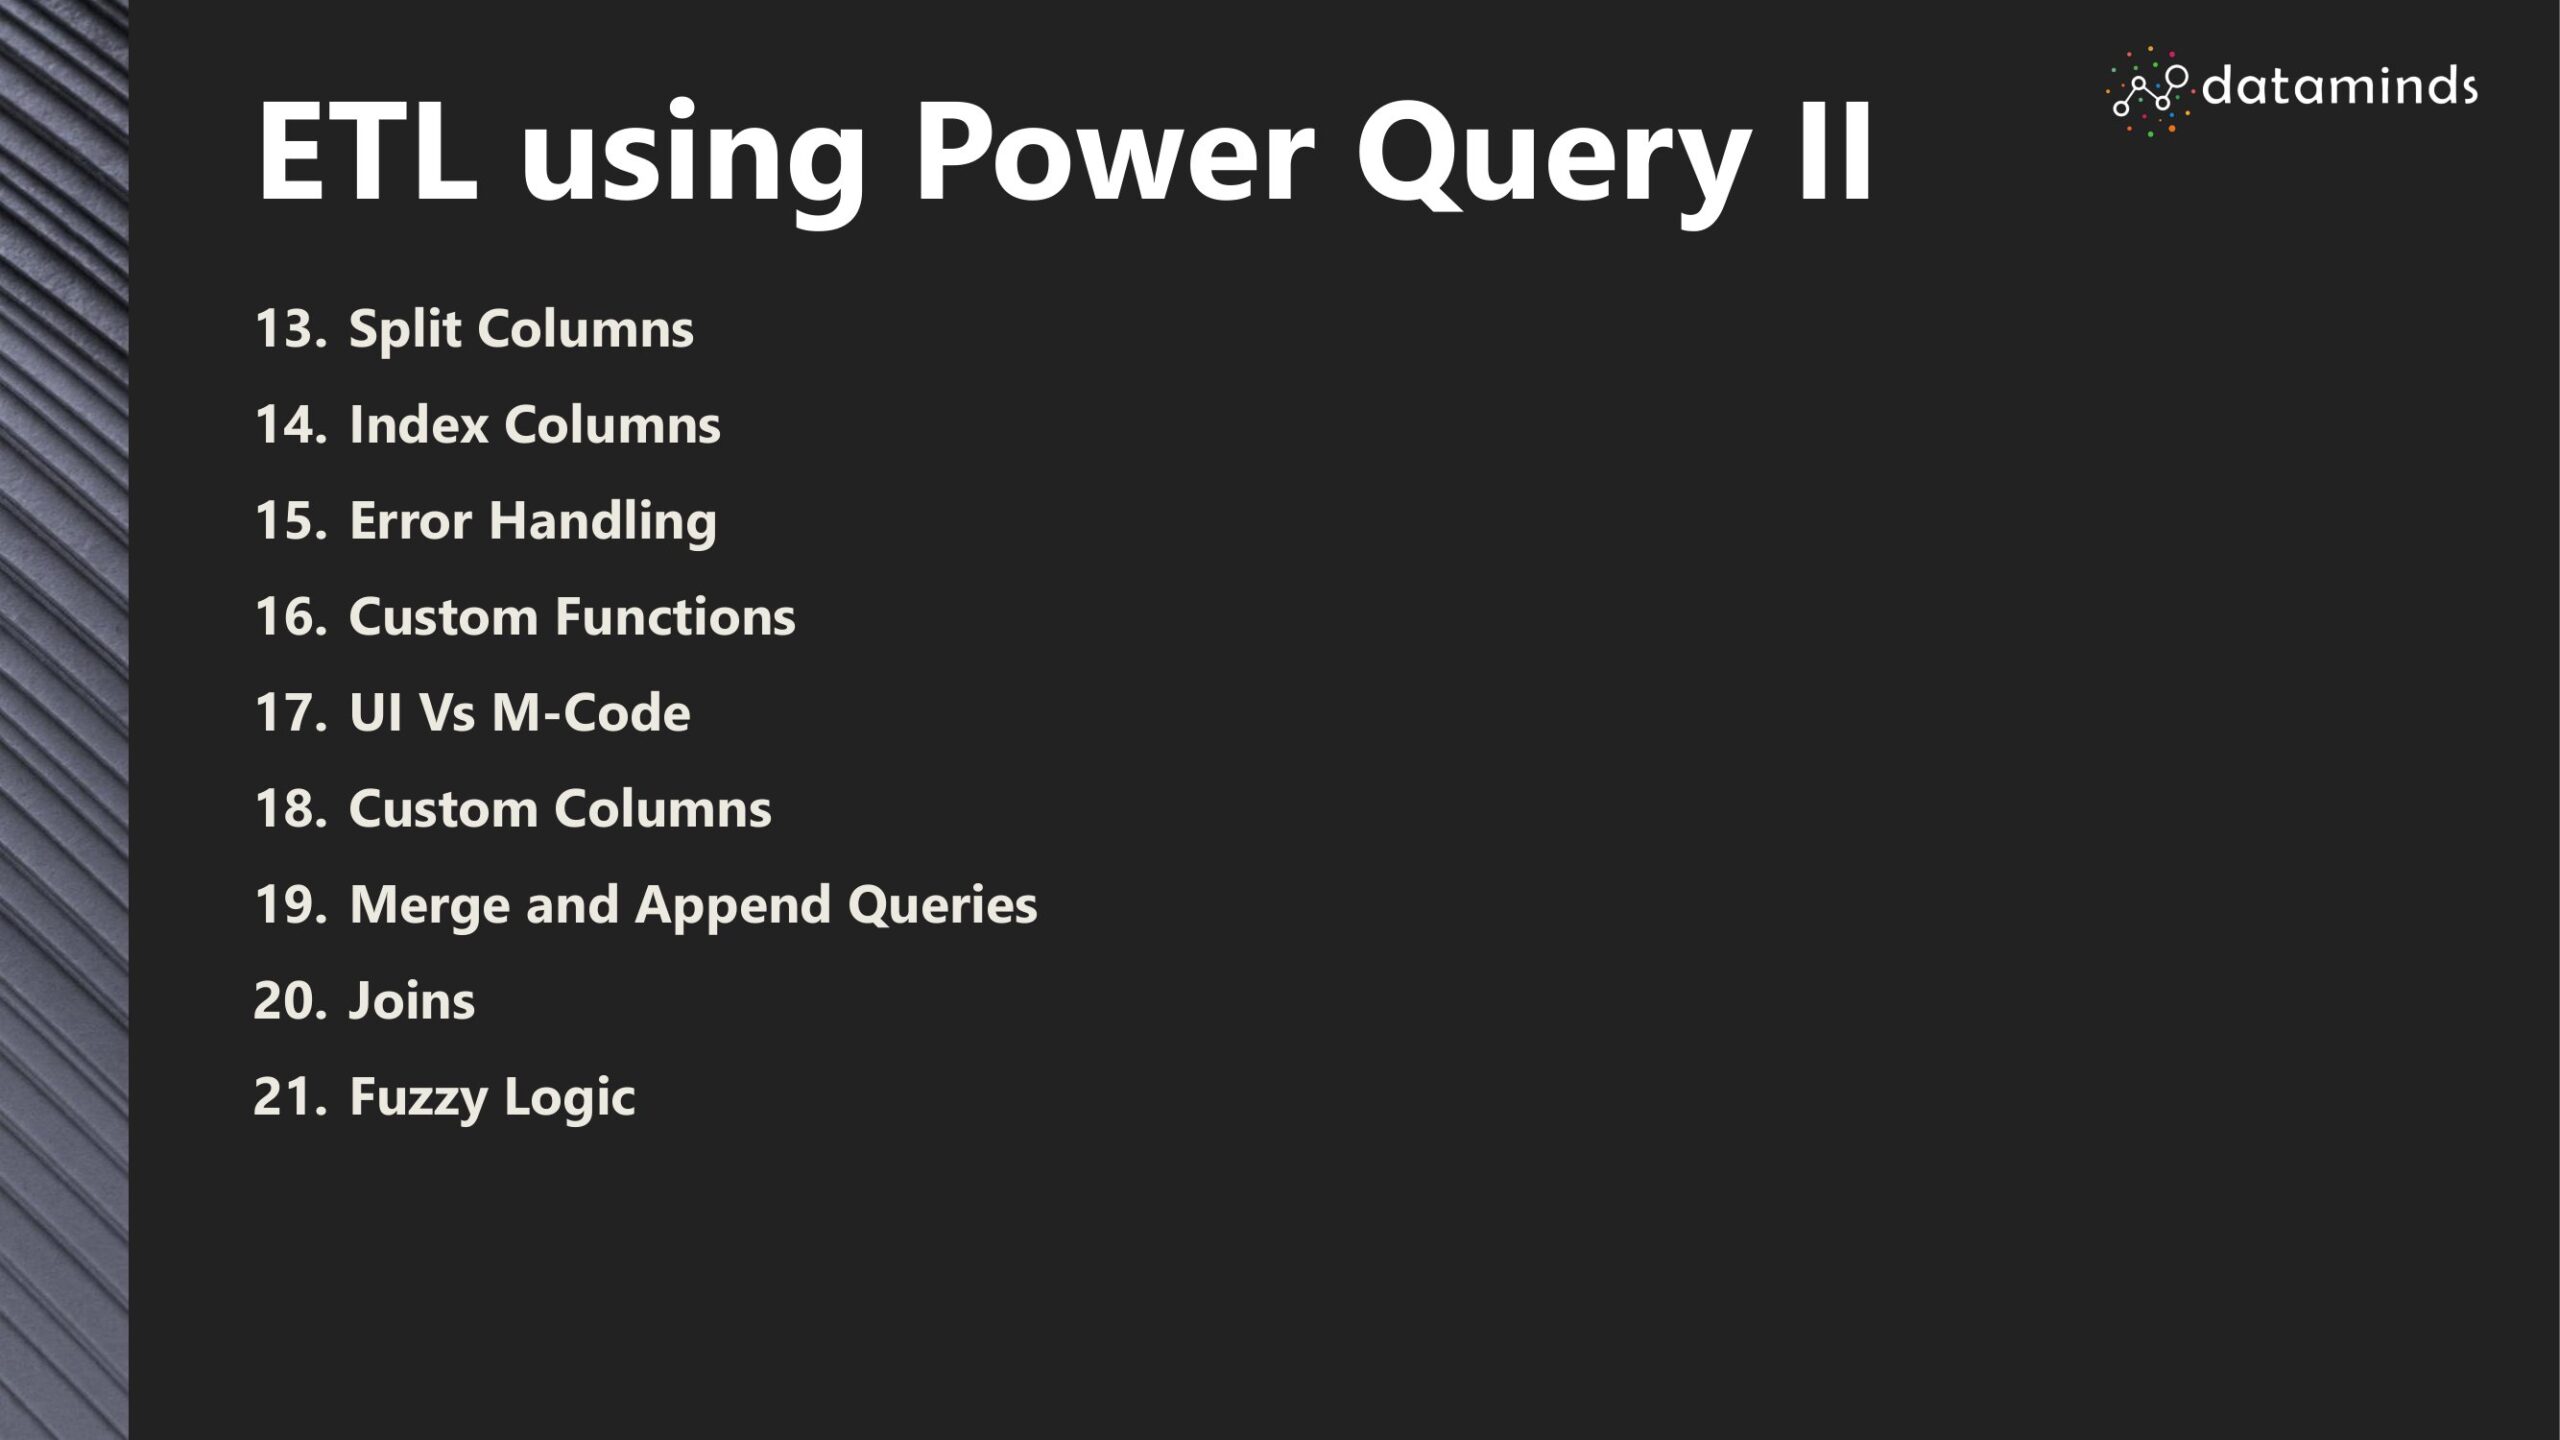
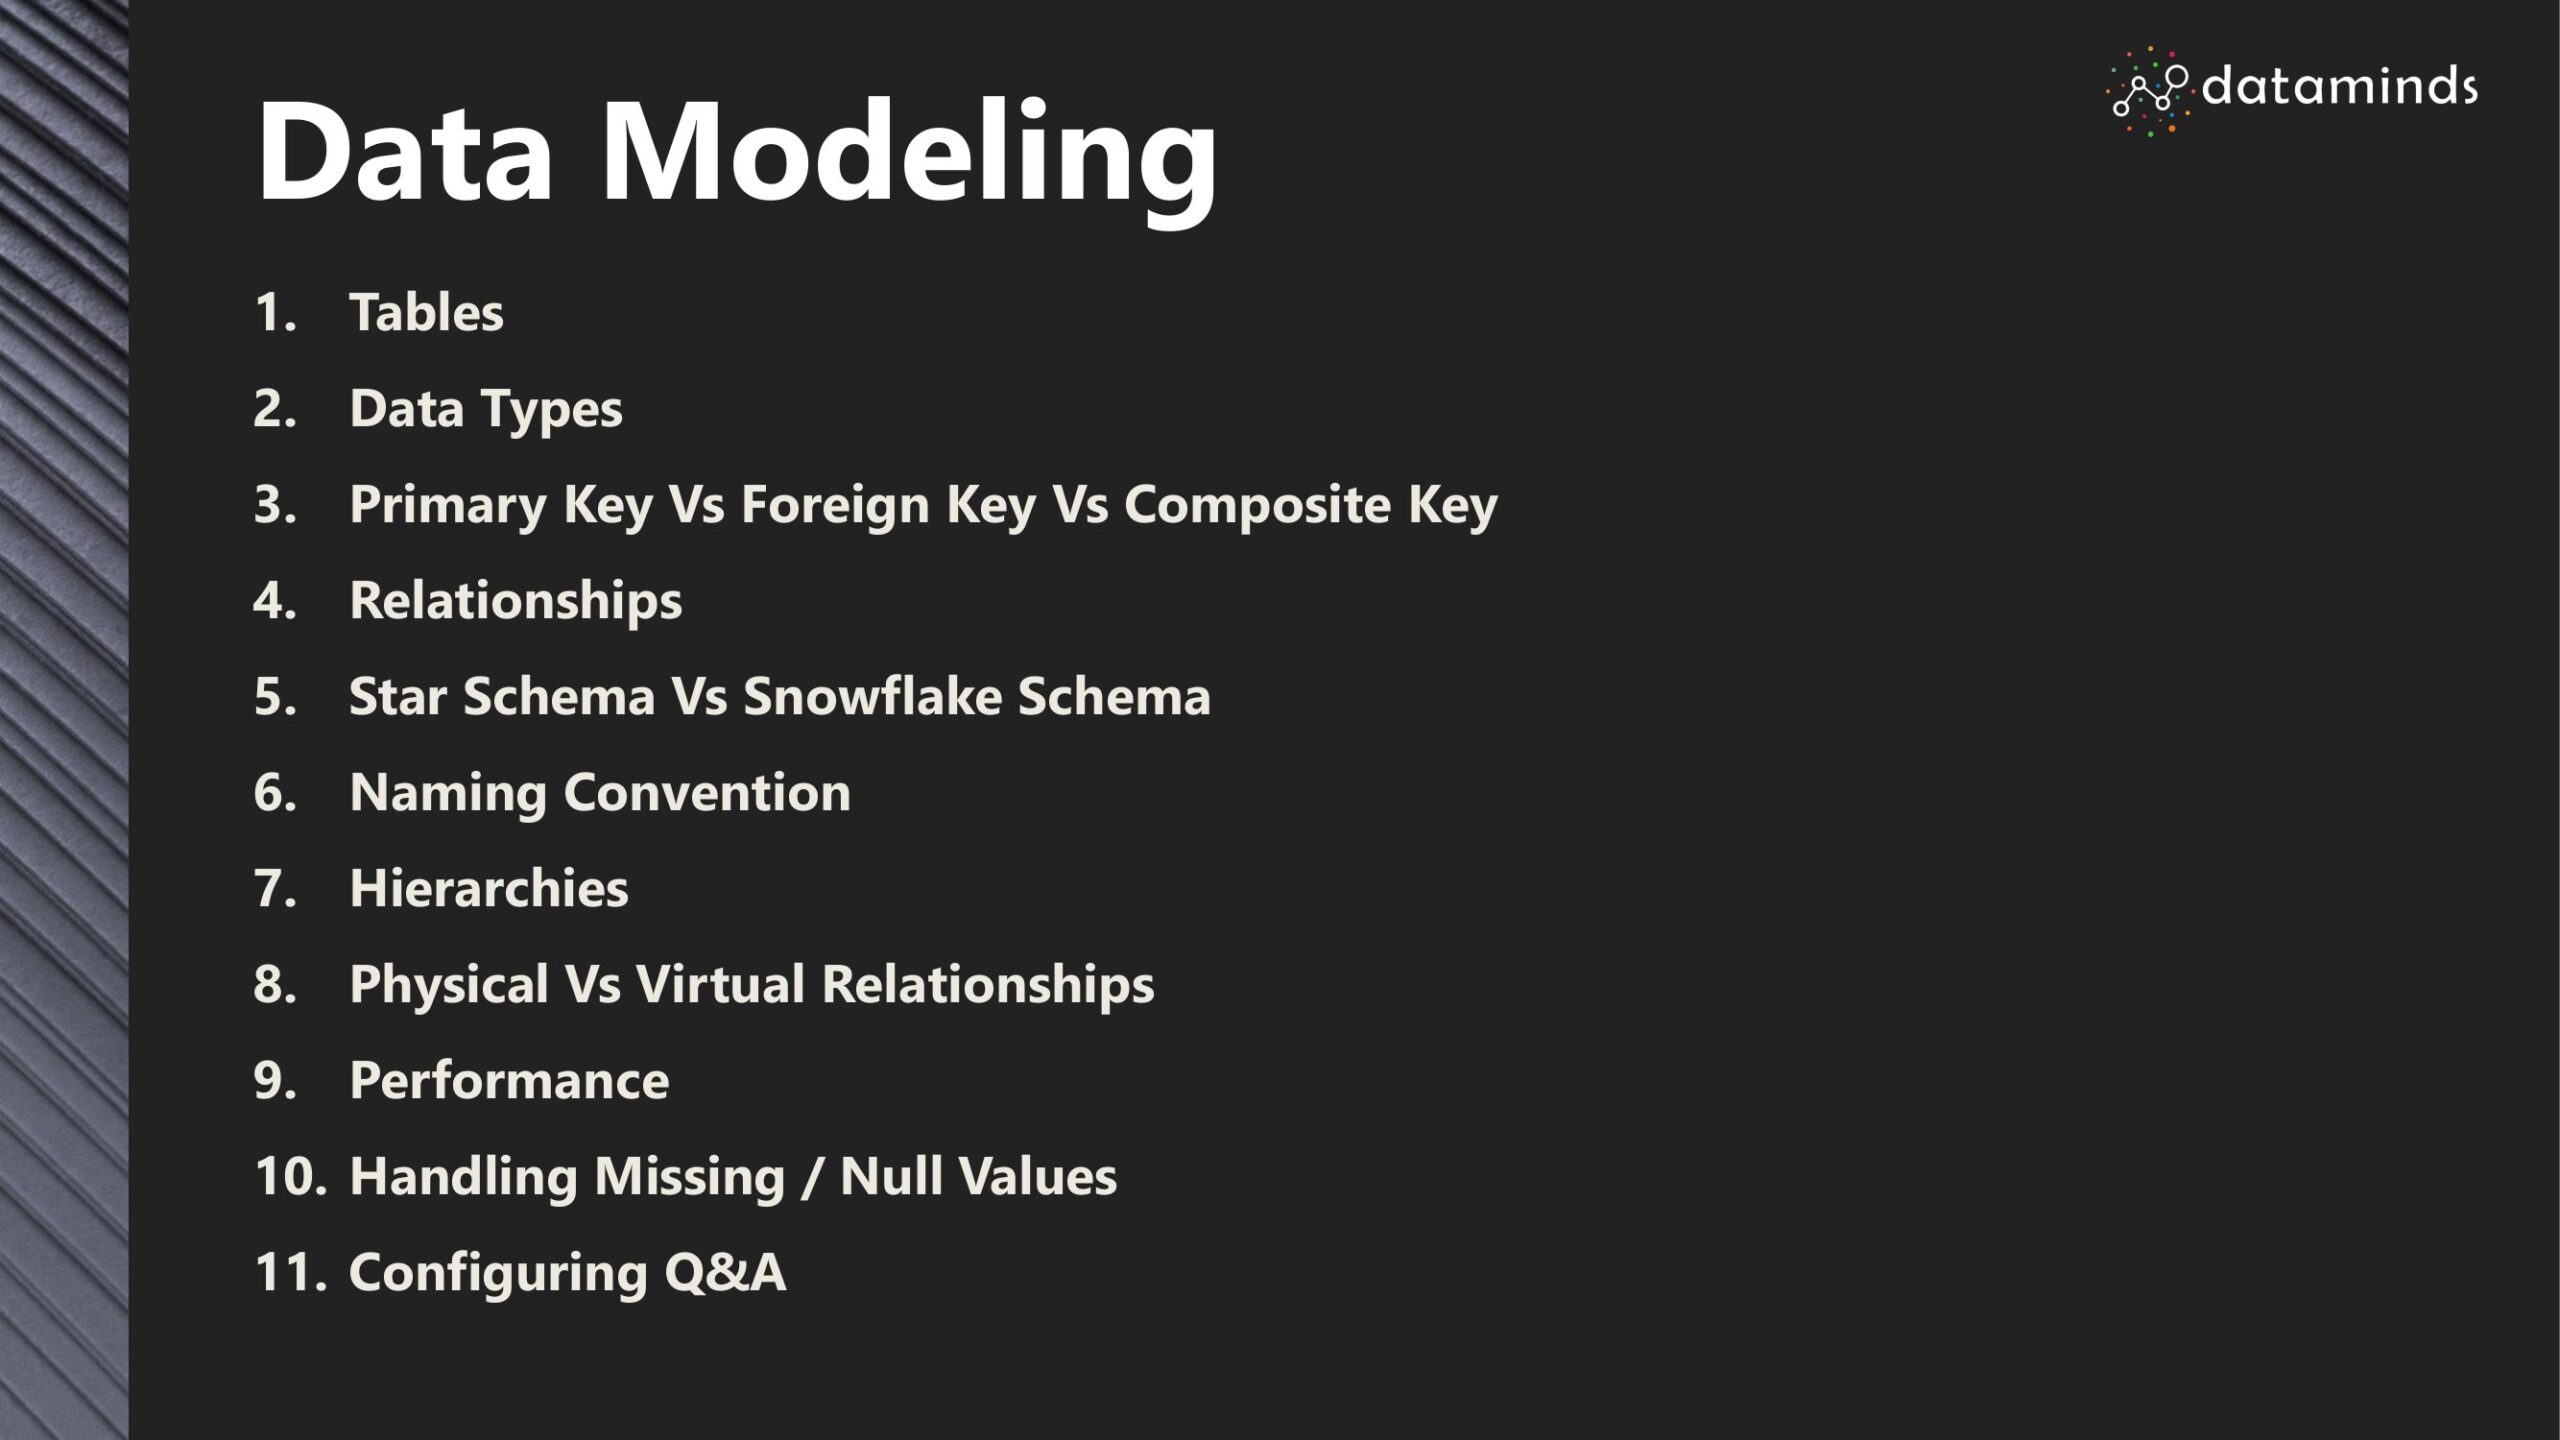
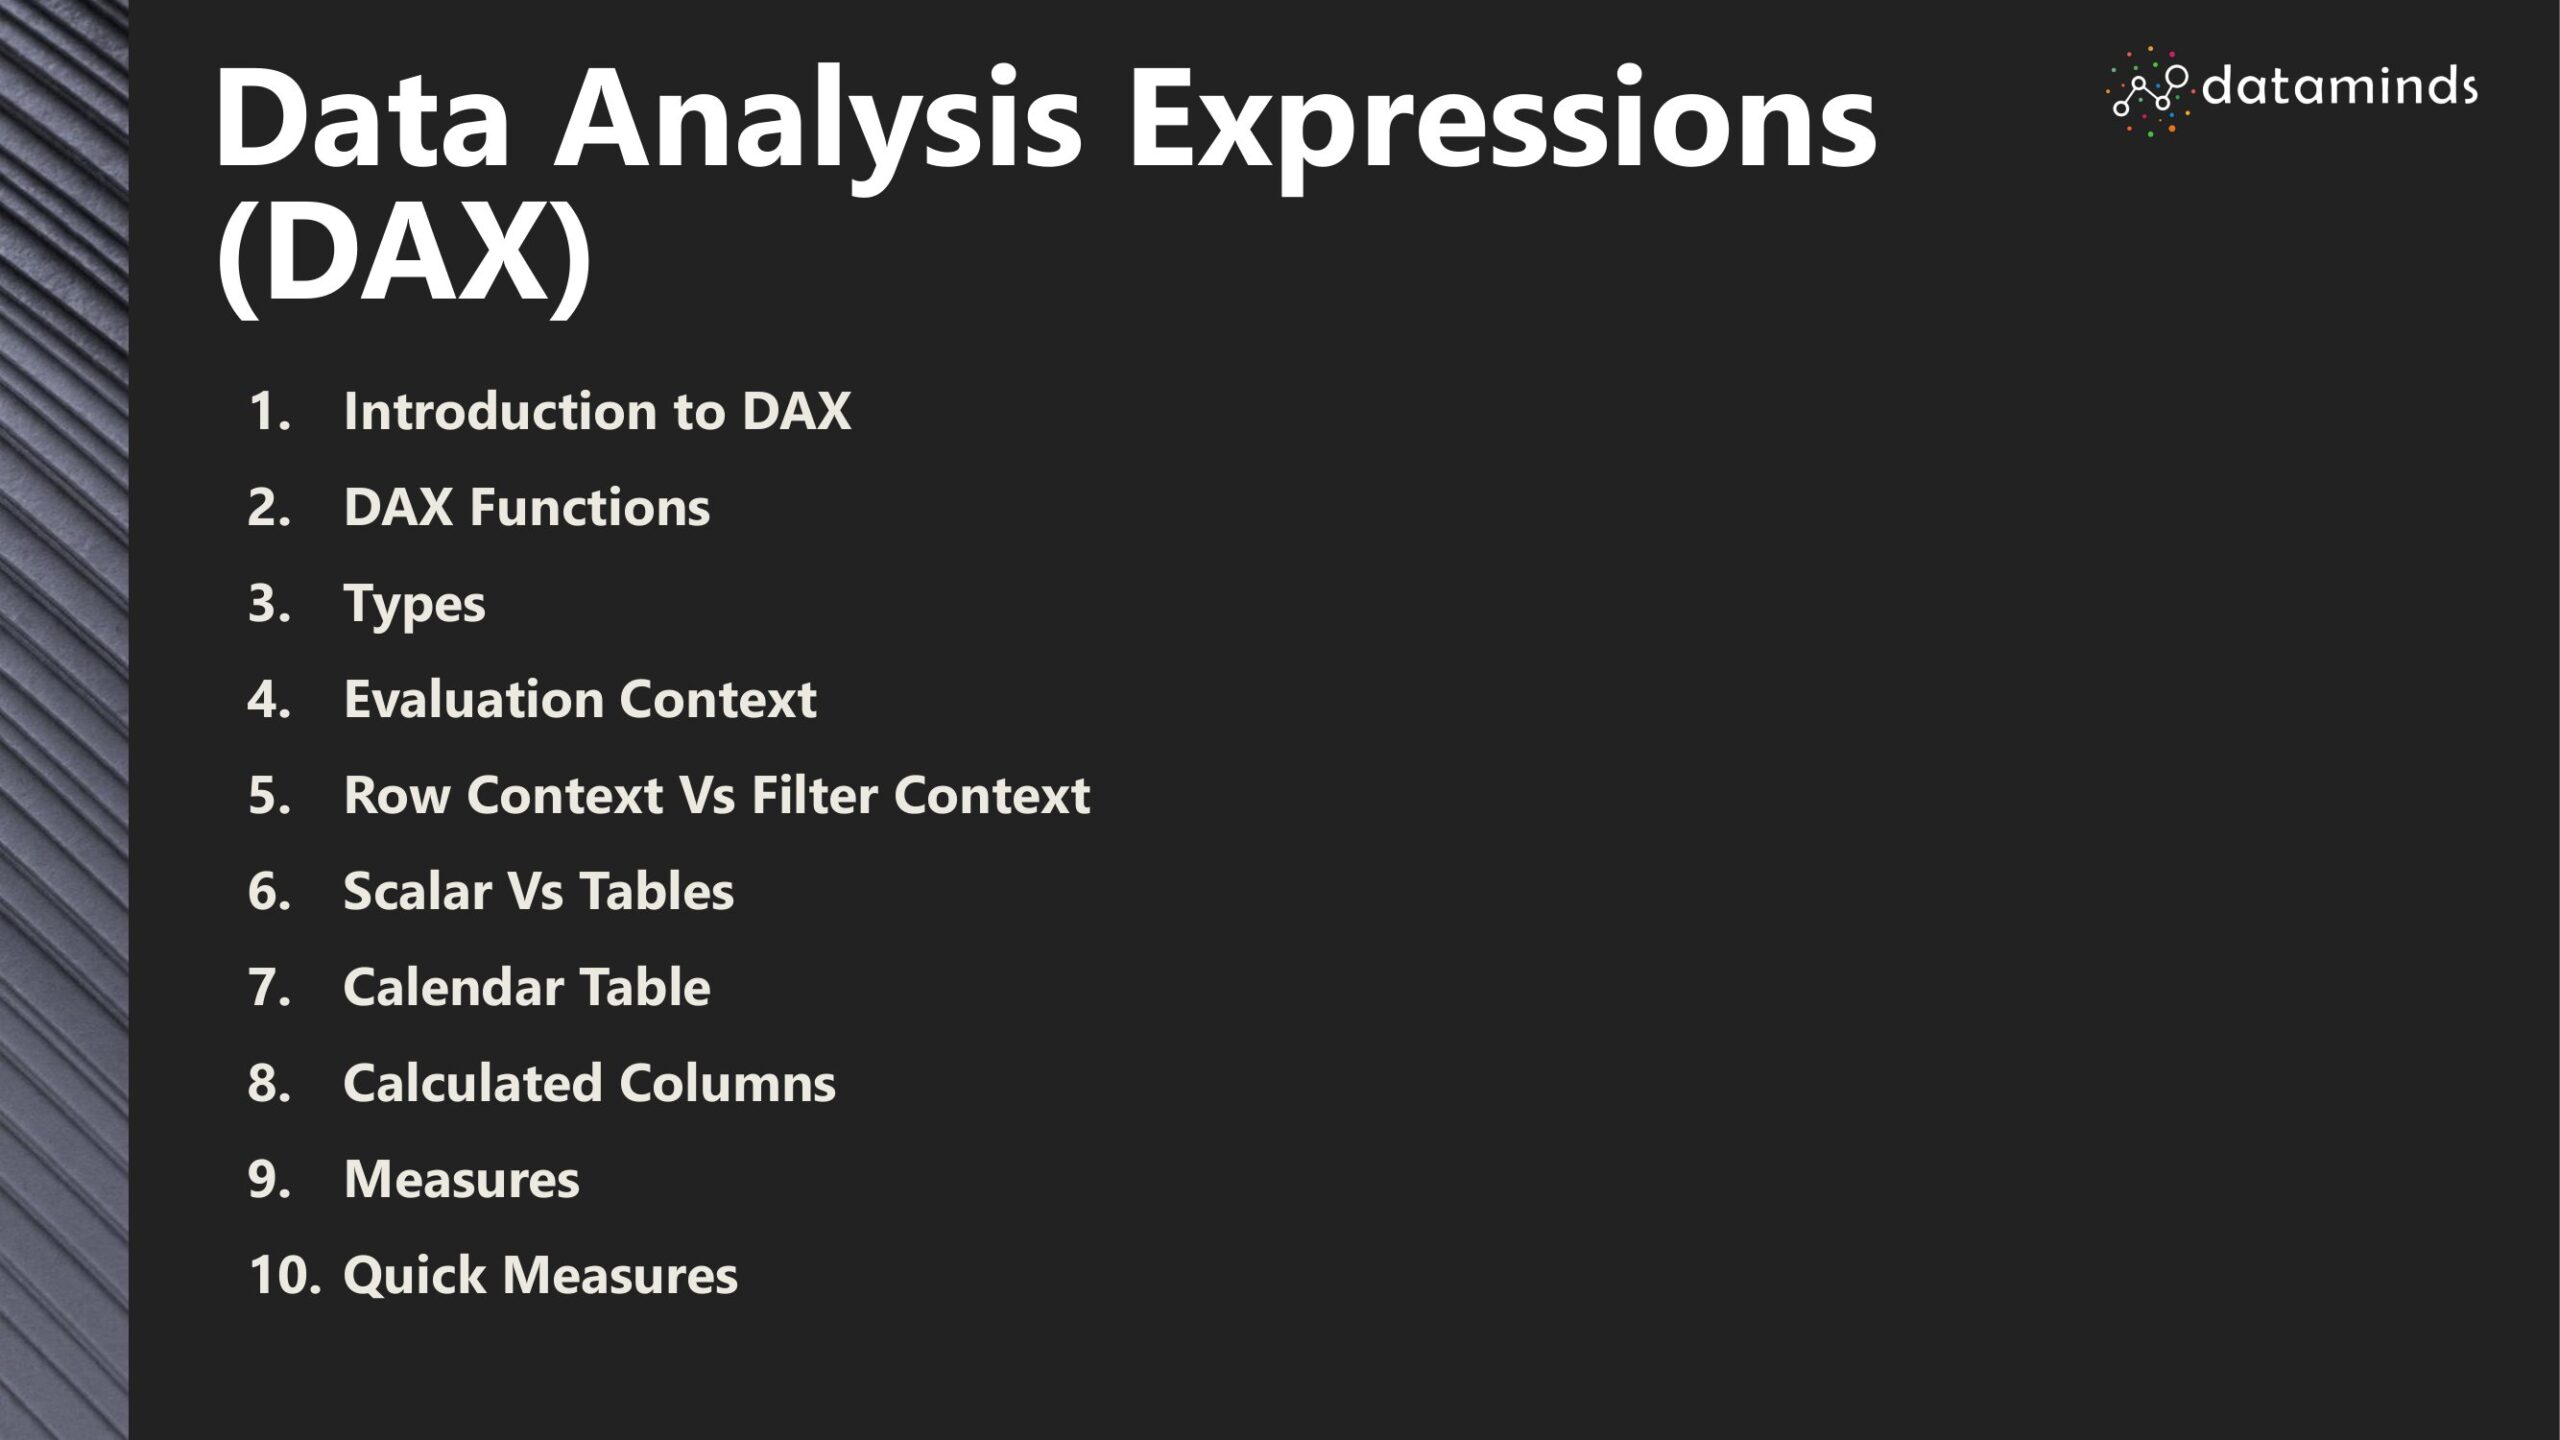
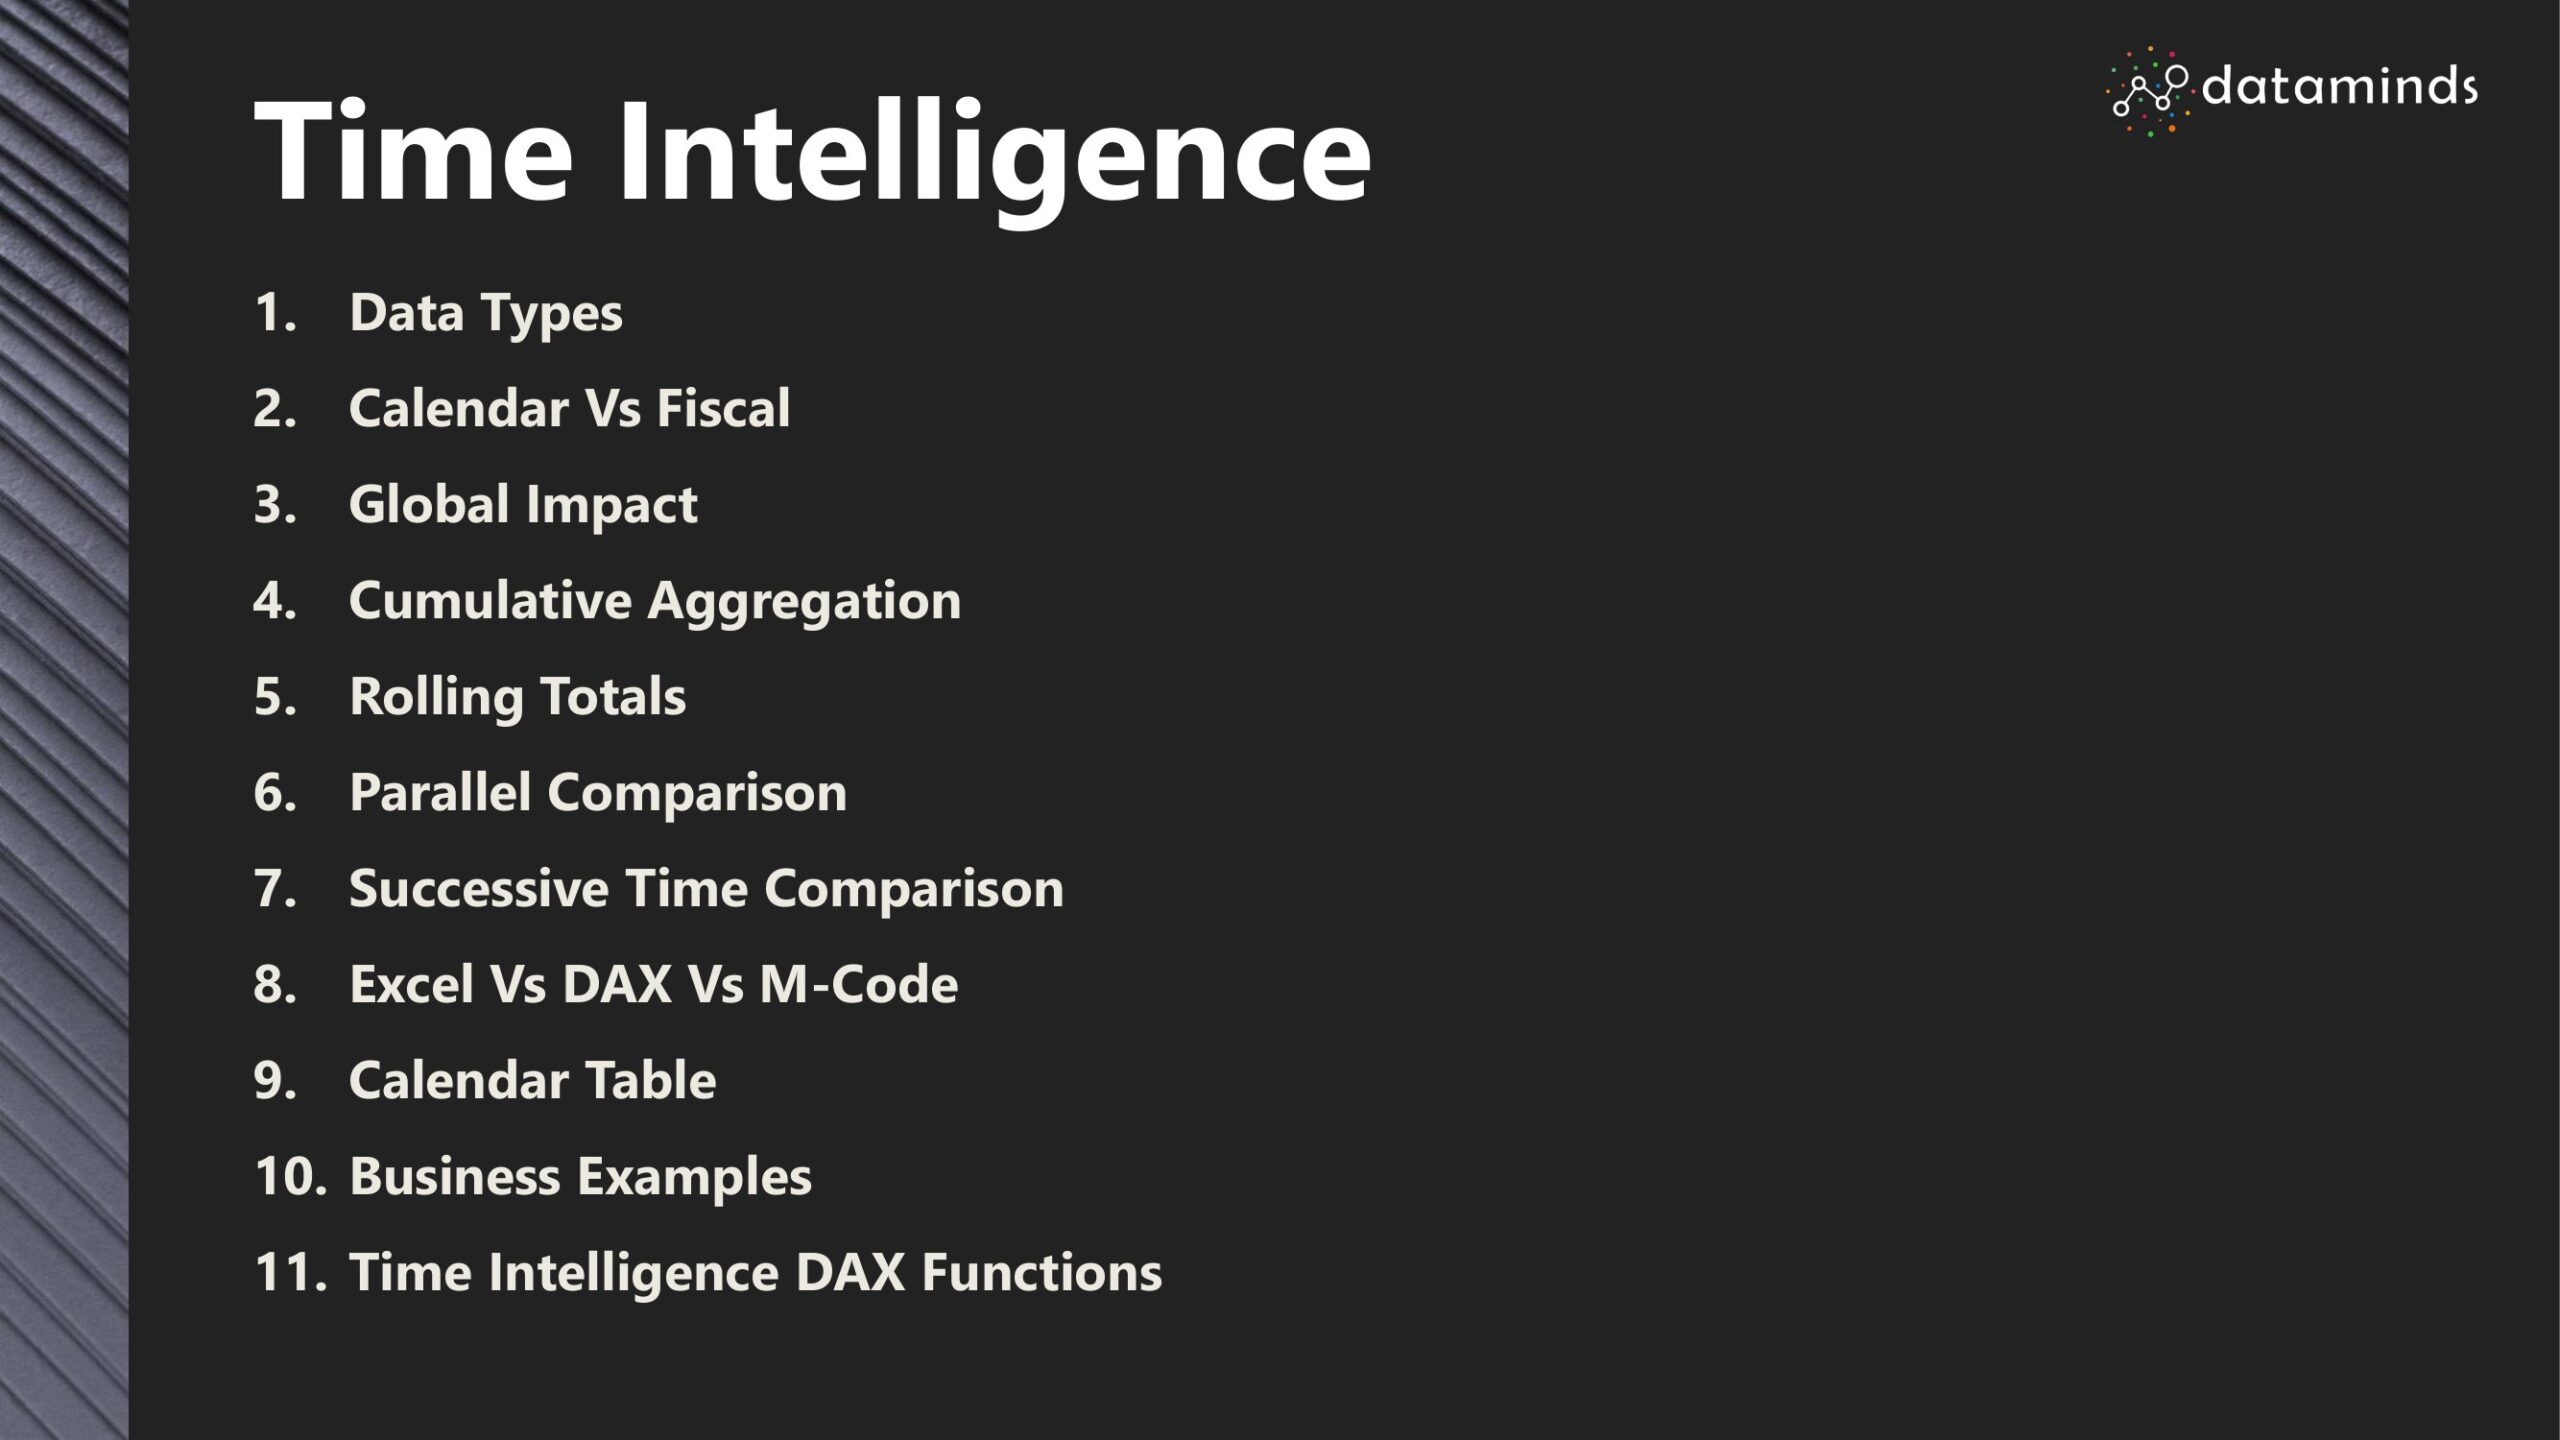
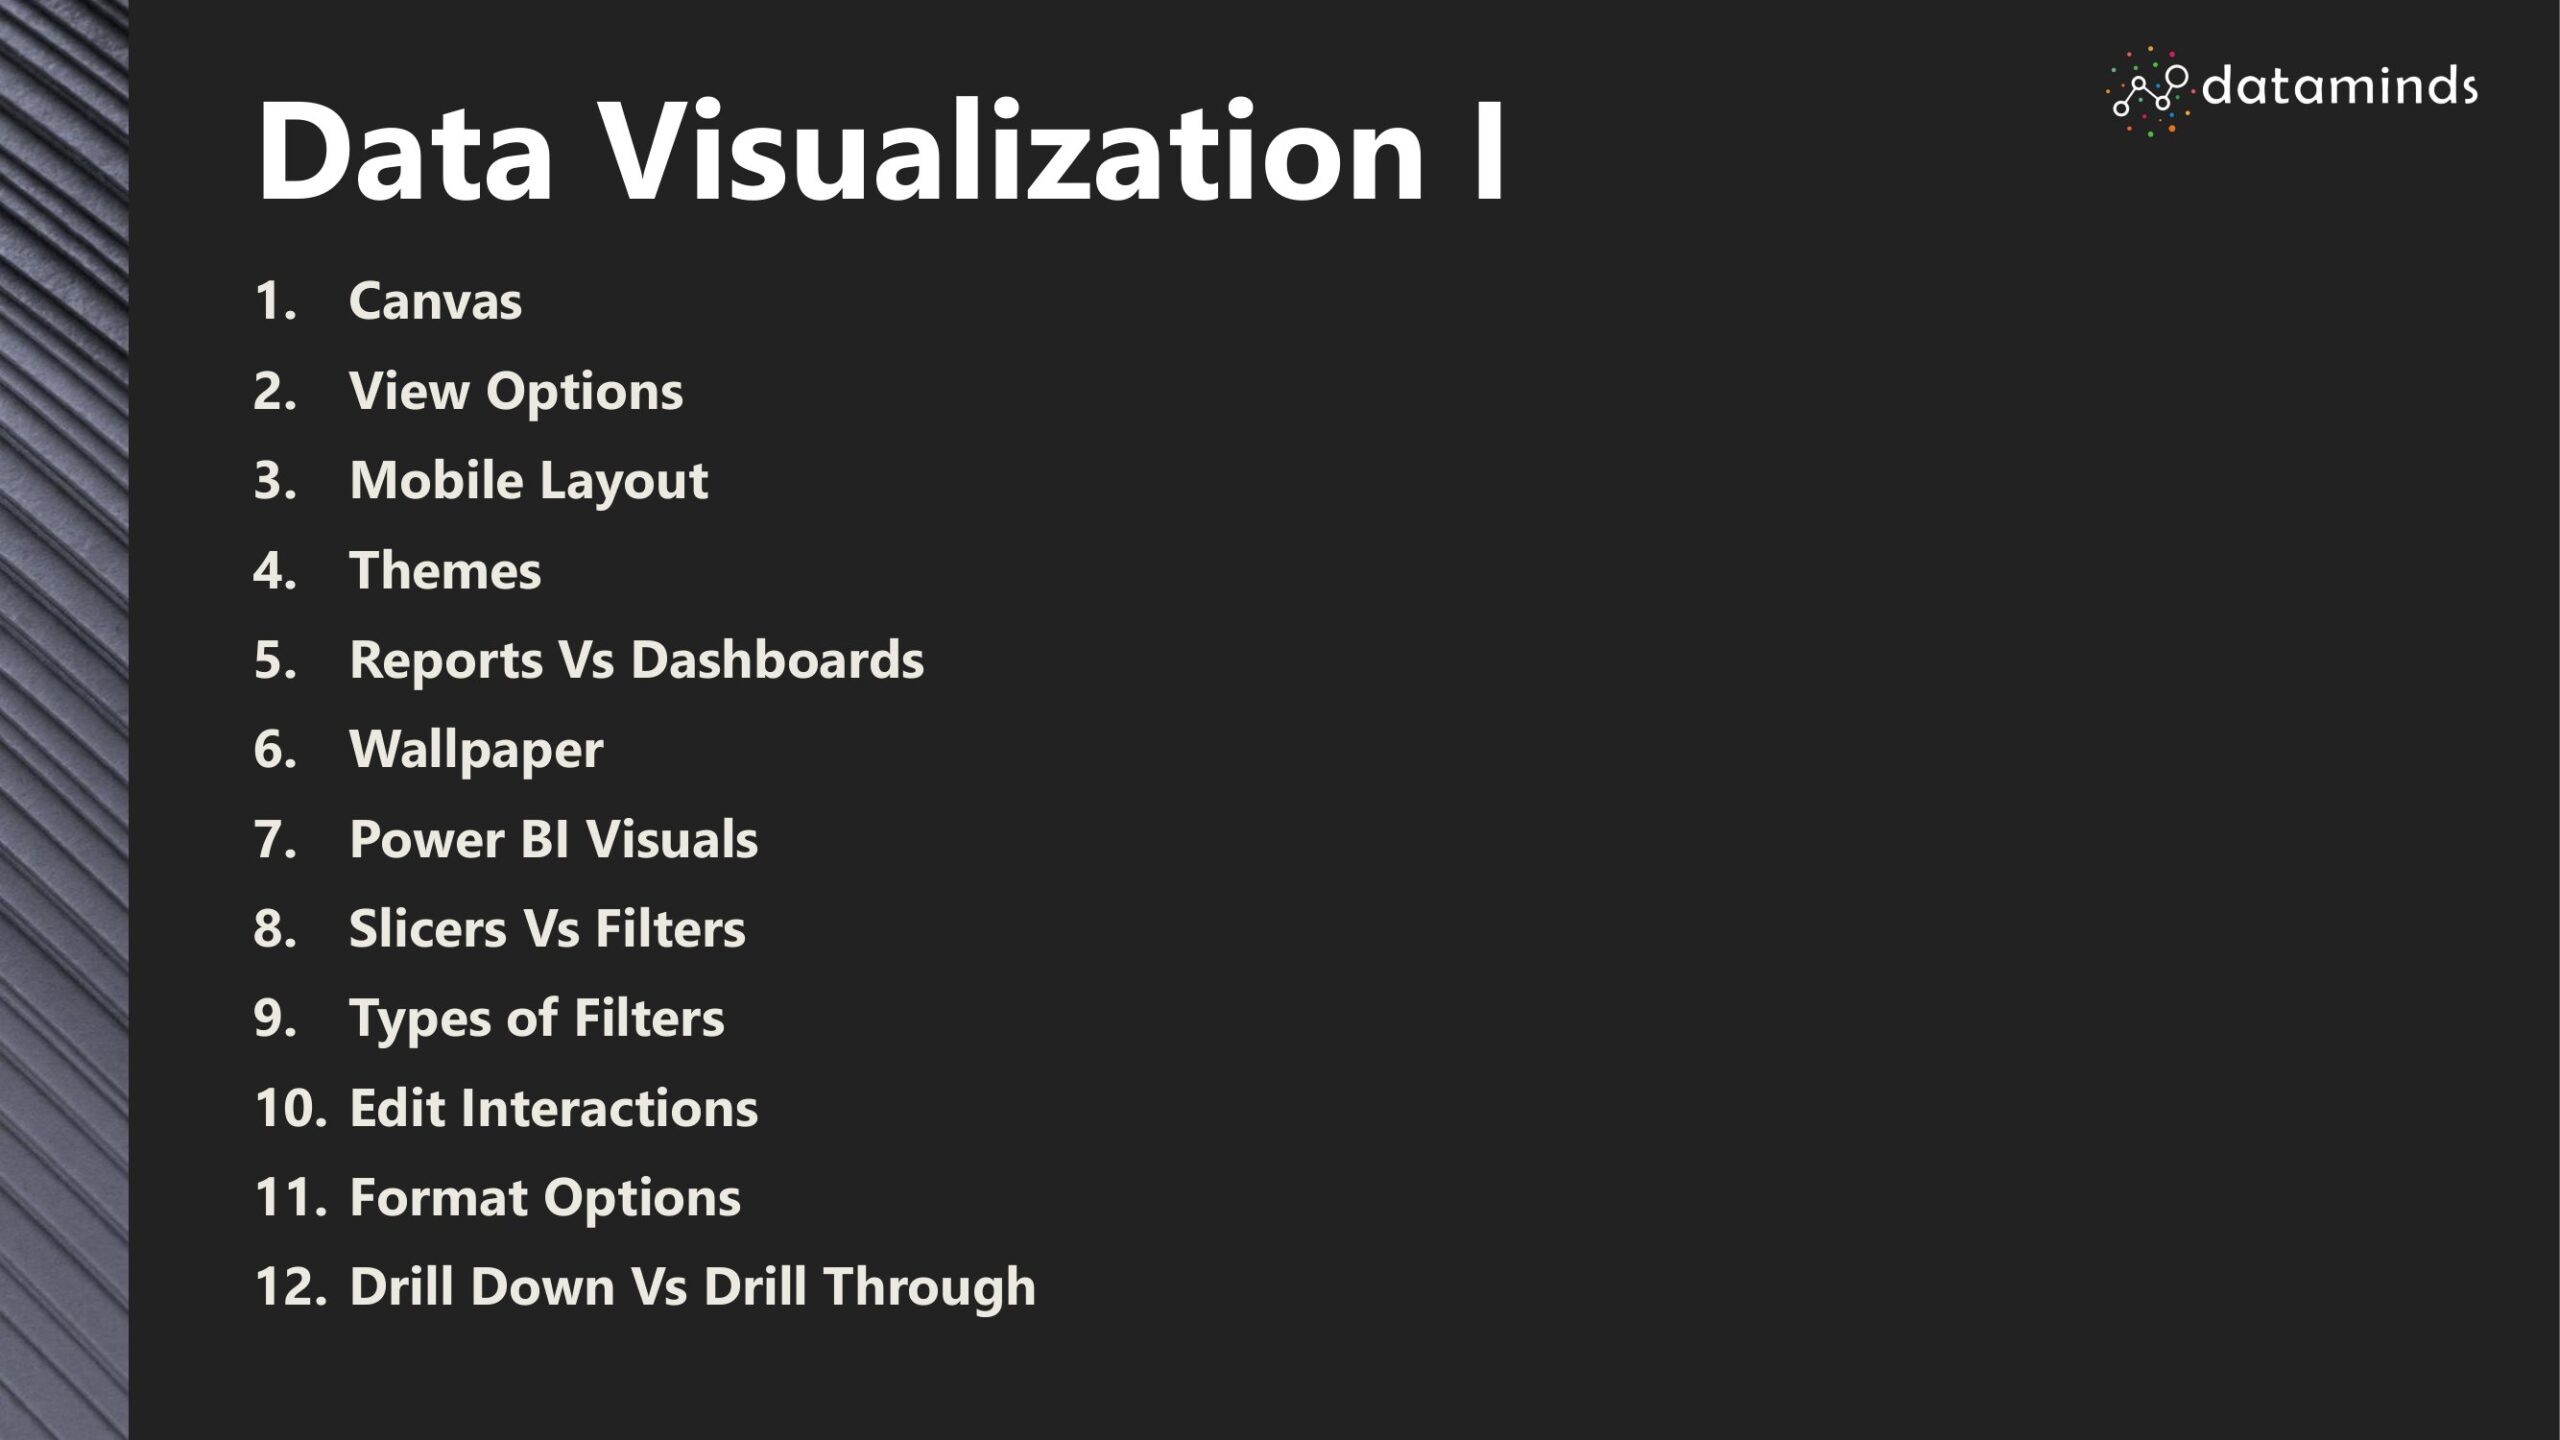
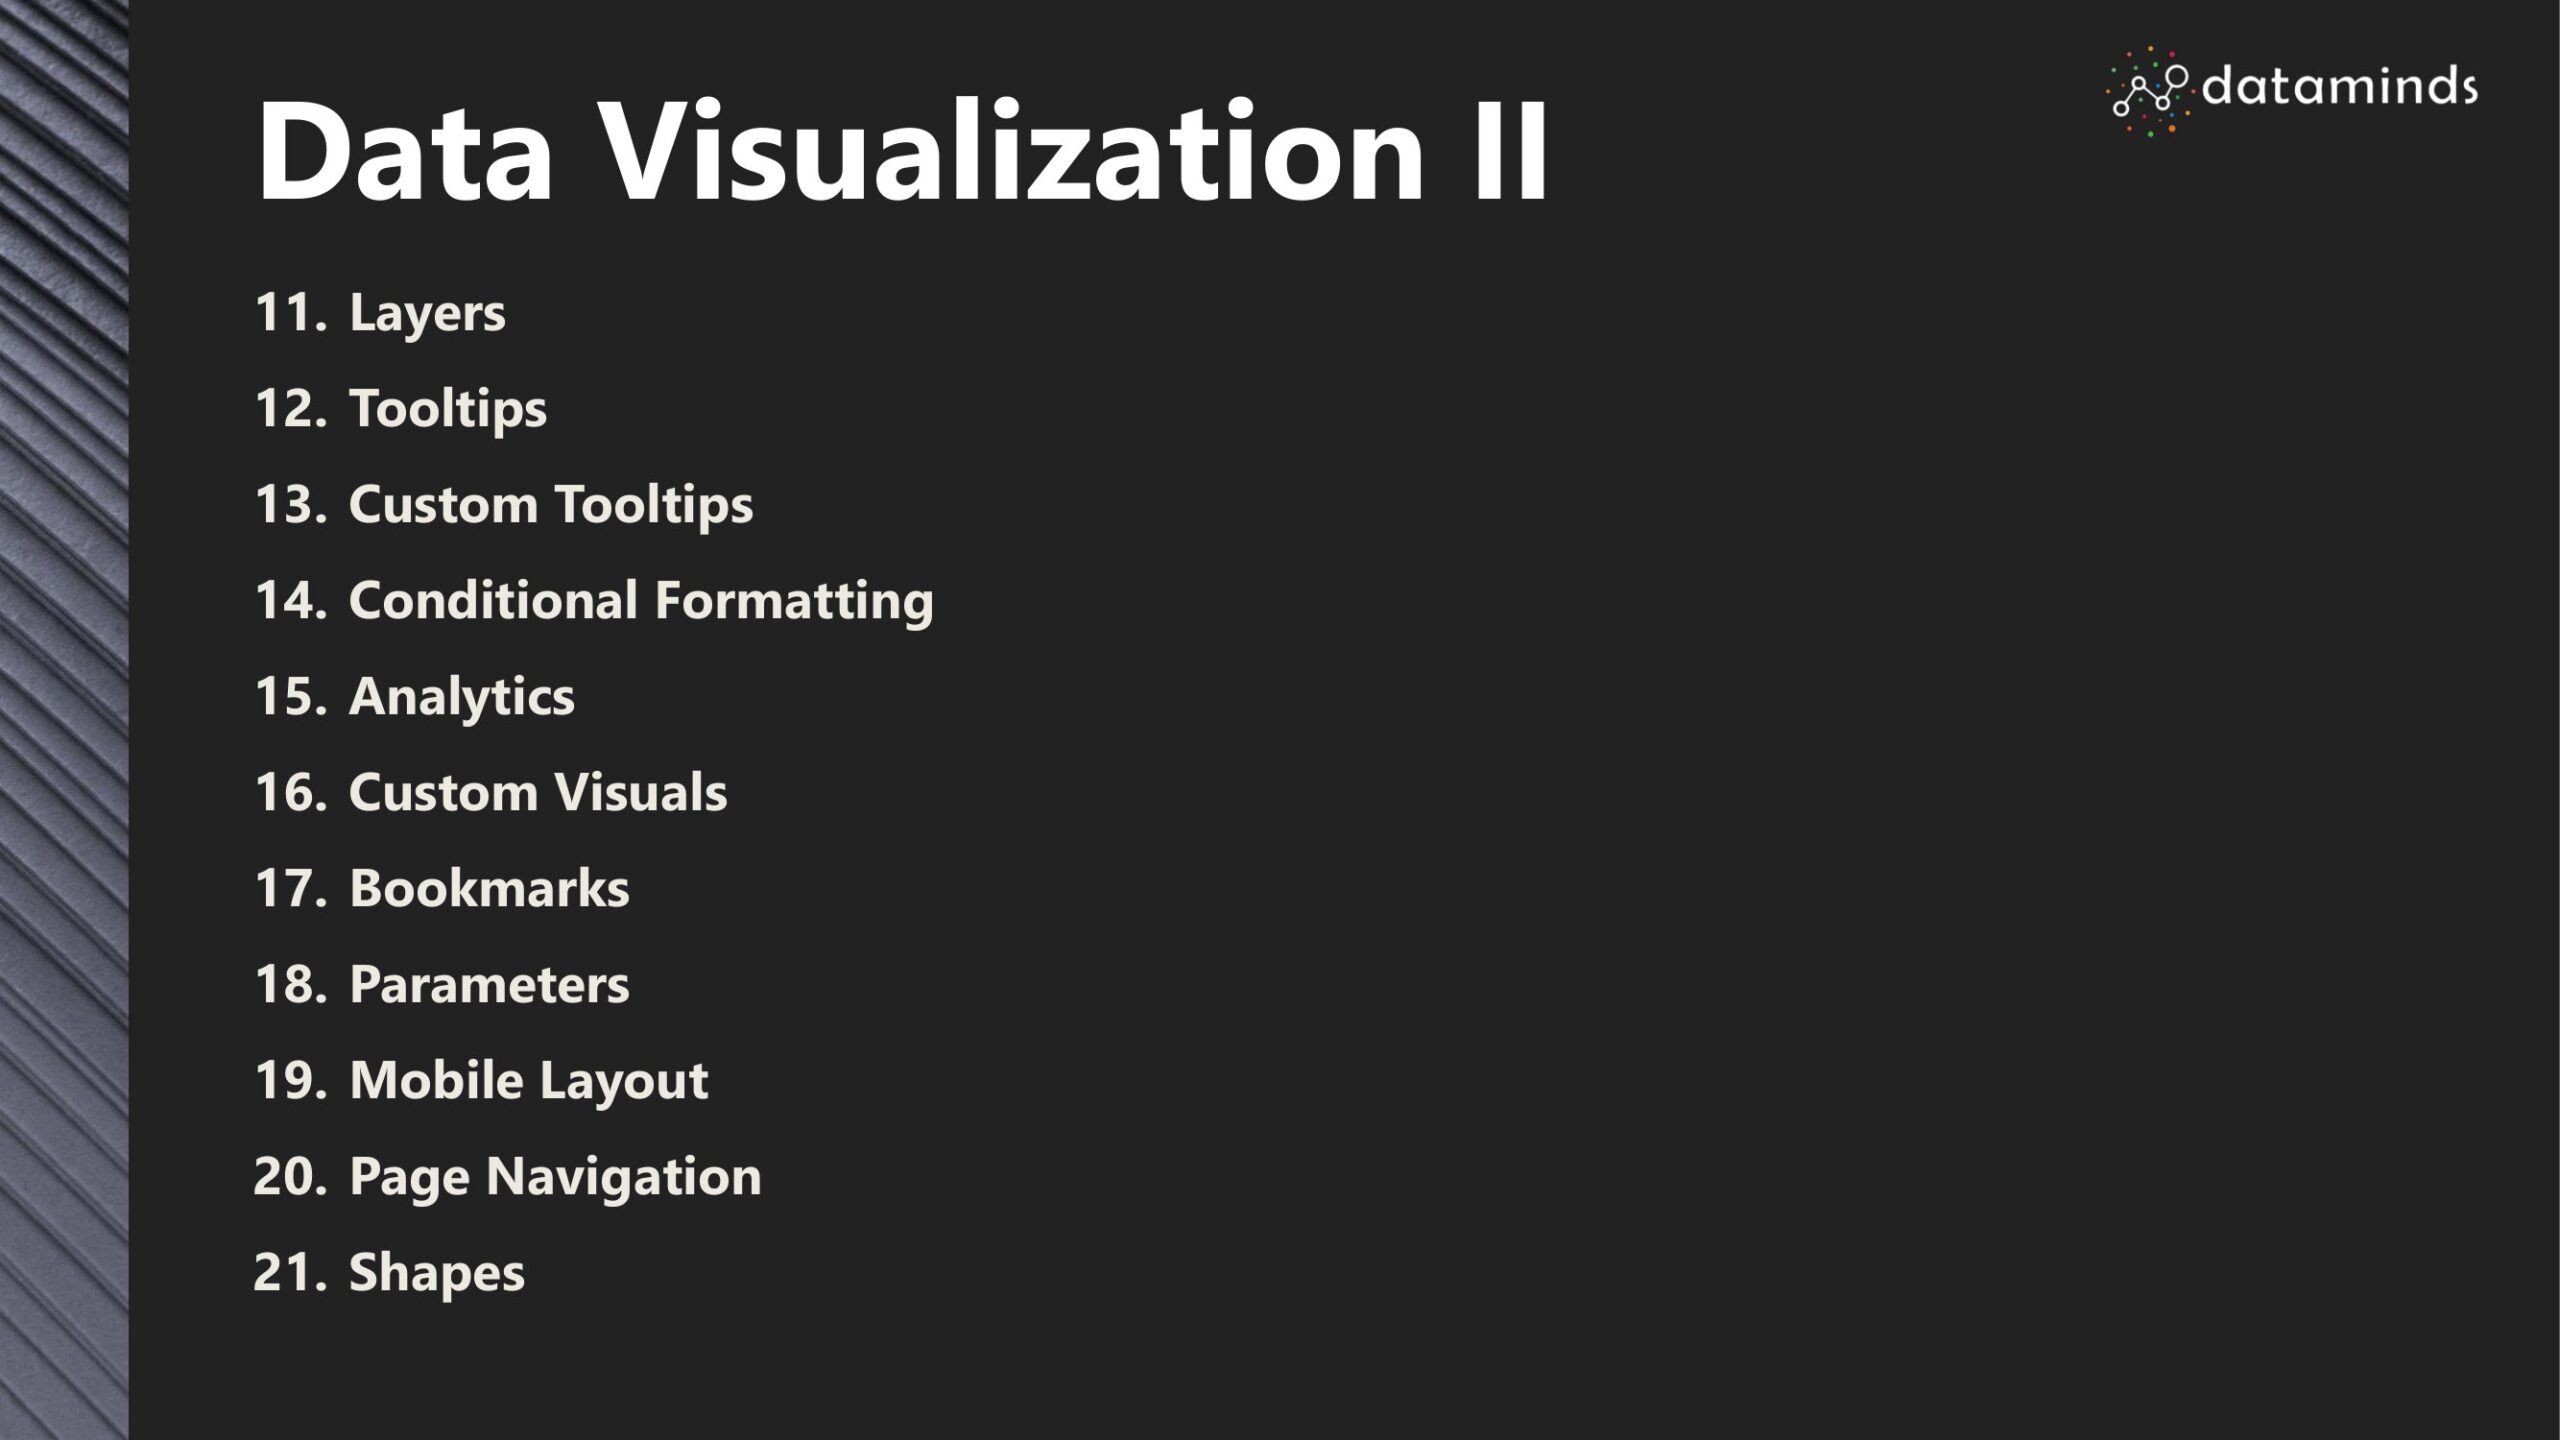
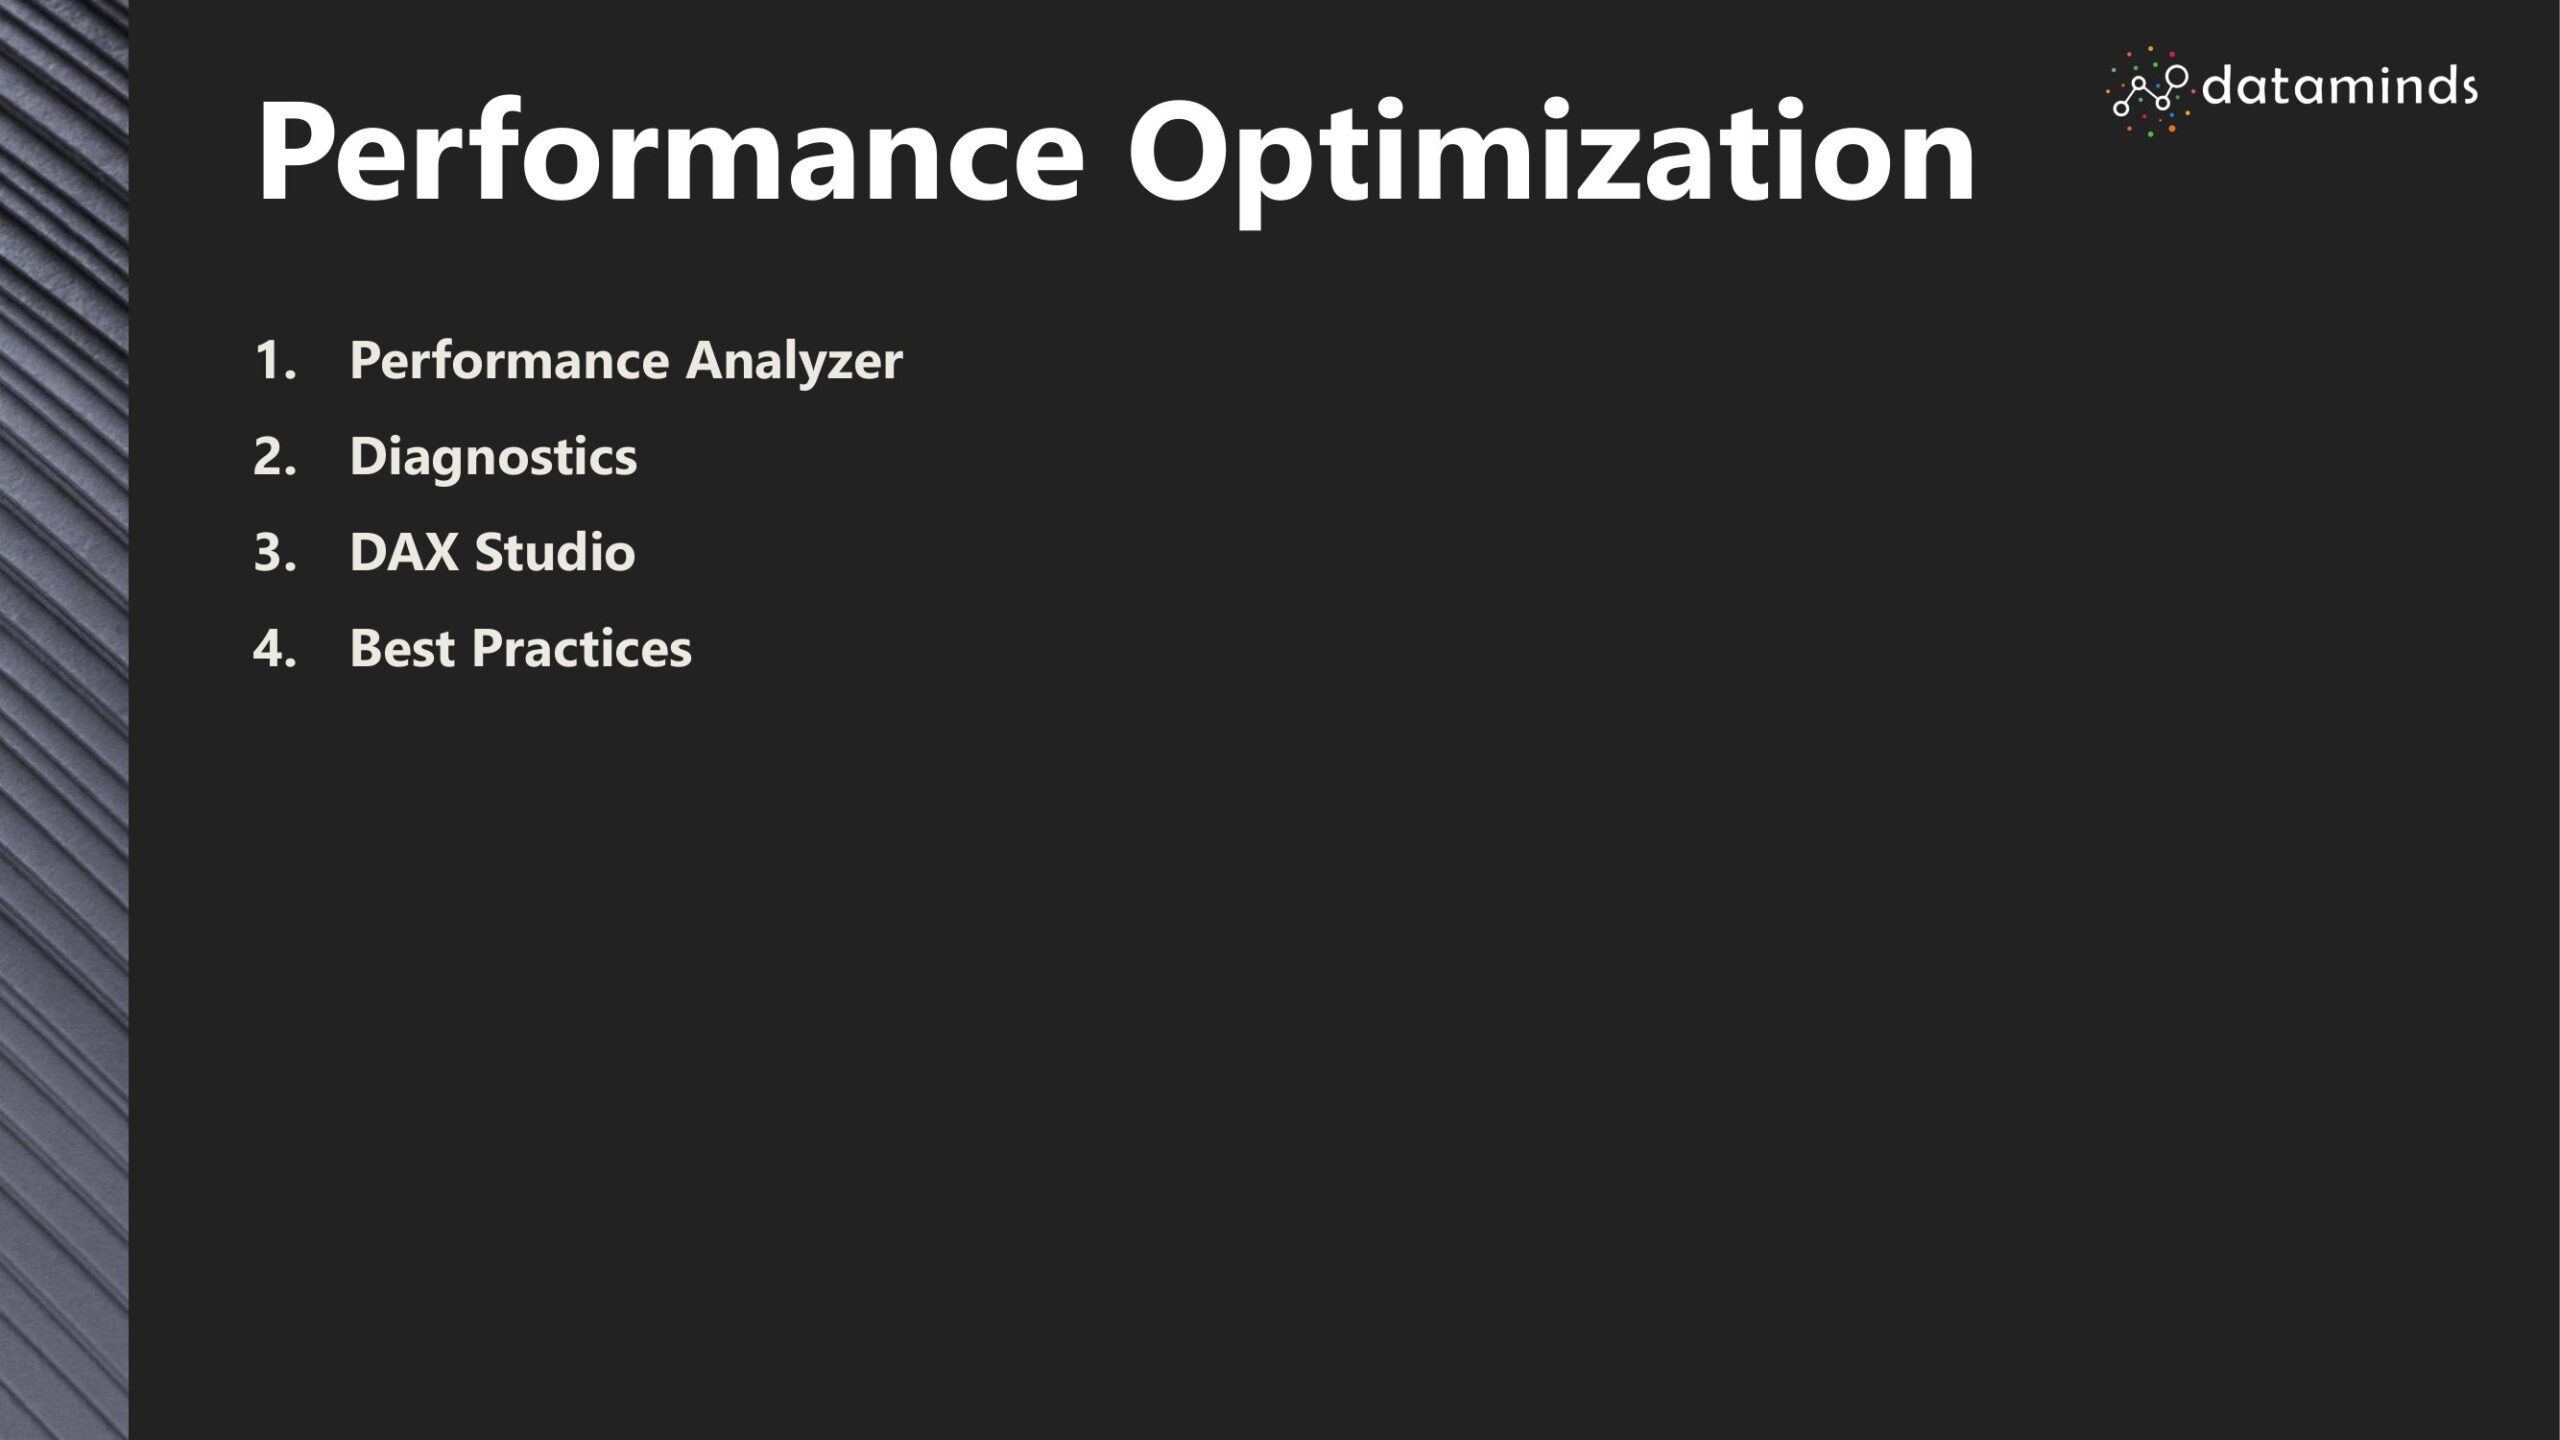
PowerBI Certification Course Curriculam

PowerBl Training Modes
We have Physical instructor led classes happening at Himayath Nagar , Ameerept & Hitech City Branches, Hyderabad.
We teach Courses online Using tools like zoom, Microsoft Teams.
How E-Learning Works?
We have recorded videos of the trainer . This videos were recorded while taking the class. We kept in mind that student should feel the classroom environment while training. we request you to take a trail session. if you are satisfied you can take up the course.
For trail session and more information you can contact dataminds sales team on +917995159109 or write us at info@dataminds.in
We offer special Training for Companies we first understand the company, its services and we will diagnose the present marketing practices and then we prepare a customized curriculum that suits to the needs of that particular company.
For Corporate training you can Reach our Sales Team at +918008884446 or you can also write to us at info@dataminds.in

PowerBl Live Projects
- Financial Performance Analysis: Create dashboards to monitor key financial metrics, analyze revenue trends, track expenses, and compare budget vs. actual performance.
- Risk Management: Visualize risk exposure, assess credit risk, and identify potential fraudulent activities through data analysis.
- Portfolio Management: Analyze investment portfolios, track asset performance, and provide interactive reports for clients.

- Patient Data Analytics: Analyze patient demographics, medical histories, and treatment outcomes to improve patient care and resource allocation.
- Healthcare Trends: Visualize disease prevalence, monitor outbreaks, and track healthcare utilization patterns to inform public health initiatives.
- Operational Efficiency: Optimize hospital operations by analyzing patient flow, staff schedules, and resource allocation for improved efficiency.

- Customer Usage Patterns: Analyze call data records, text messages, and data usage to identify customer behavior and preferences.
- Network Performance: Visualize network data to monitor call quality, signal strength, and data throughput, enabling proactive maintenance.
- Customer Experience: Create dashboards to track customer complaints, service outages, and response times for better service delivery.

- Sales and Inventory Analysis: Analyze sales data, track inventory levels, and monitor demand patterns for different vehicle models.
- Maintenance Tracking: Create dashboards to monitor vehicle maintenance schedules, identify recurring issues, and optimize maintenance processes.
- Supply Chain Management: Visualize the supply chain, track parts shipments, and monitor production processes to ensure efficient operations.

- Claims Analysis: Analyze insurance claims data to identify trends, patterns, and potential fraudulent activities for better risk management.
- Policyholder Insights: Create dashboards to track policyholder demographics, claims history, and coverage preferences for targeted marketing.
- Underwriting and Pricing: Utilize data analysis to assess risk factors and determine optimal insurance pricing based on various variables.

- Real Estate Market Trends: Analyze property sales data, rental rates, and market trends to inform real estate investment decisions.
- Tenant Management: Visualize tenant occupancy, lease terms, and maintenance requests to improve property management processes.
- Property Valuation: Utilize data analysis to estimate property values based on market conditions, location, and property features.
![]()
Get Course Completion Certificate
")
Our Alumni Testimonials
Rated Avg 4.8* Out Of 5 by 2000+ Learners")


PowerBI Course Training Fee
Rs. 25,000/- | 2 Months
Data Minds Learning Plus
✓ Options to choose either Classroom, Online Or Self paced Learning
✓ 100+ Learning Hours
✓ World Class Learning Management System (Long Term – 1Year Access with Mentor facility)
✓ 10+ Projects
✓ 100% Placement Assistance
✓ Dedicated Placement Manager for Interview Process
✓ Access to the Instructor for doubts clarification during and after the course
✓ Connect to our Network with alumni ,working with different Industries
Our Students Hail From
Students, Working Professionals & Business Owners From Various Start Ups And MNC’s


FAQs for Professional PowerBI
1.What is Data Visualizatoin ?
Data visualization is telling a story using visuals/graphics that data alone cannot tell. Data visualization should not be confused with a beautiful aesthetic, which is a way of solving business problems.
2. How Many Batches Can I Attend, If Enrolled For Training?
Data Minds offers a mixed learning model. With this model, you can log in once to take classes in the classroom, live online classes taught by instructors, and e-learning classes (recorded sessions). Combining these three will create a synergistic effect on learning. Data Minds allows him to attend multiple instructor-led live online sessions for one year at no extra charge.
3. Live Training Or Recorded Sessions?
This is a live, instructor-led, timed interactive session where participants and trainers log in at the same time. The same session is also recorded and access is granted to replay, summarize or view the missed session.
4. What If I Miss A Live Session?
Missed the live Power BI session for some reason? No problem. Each session is recorded and access to all videos is provided by Data Minds’ state-of-the-art Learning Management System (LMS). Recorded Power BI sessions can be viewed comfortably at your own pace.
5. Can I earn a certification from Data Minds after completing a Power BI course?
Yes, upon successfully completing the course, you will receive a course completion certificate from Data Minds Analytics
Yes, upon successfully completing the course, you will receive a course completion certificate from Data Mins
Admissions Support
Queries, Feedback & Assistance